Ancestry.com — Q2 2010 Earnings Presentation
12 slides from Ancestry.com's earnings presentation, Jul 29, 2010

Slide 1: Second Quarter Highlights • July 2010
1 Second Quarter Highlights • July 2010 Our mission is to help everyone discover, preserve and share their family history.
Slide 2: Safe Harbor Summary
2 This presentation contains forward-looking statements. These statements relate to future events or to future financial performance and involve known and unknown risks, uncertainties, and other factors that may cause our actual results, levels of activity, performance, or achievements to be materia
Slide 3: Executing on Our Growth Strategy
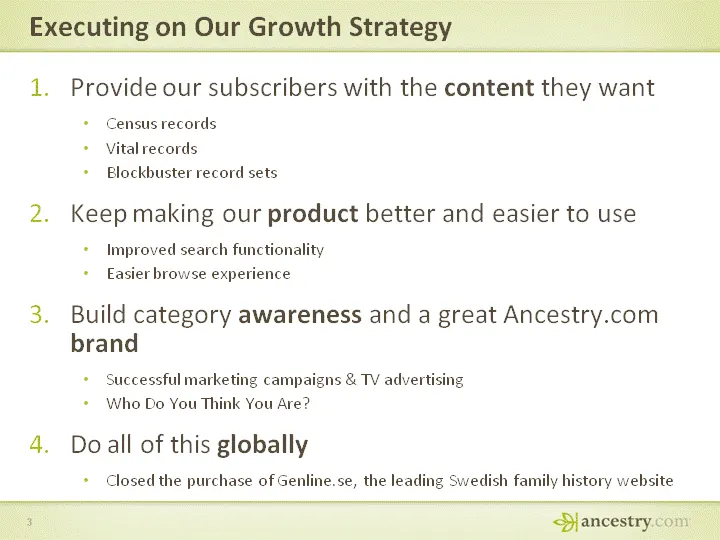
Executing on Our Growth Strategy Provide our subscribers with the content they wantCensus recordsVital recordsBlockbuster record setsKeep making our product better and easier to useImproved search functionality Easier browse experienceBuild category awareness and a great Ancestry.com brandSuccessful
Slide 4: Second Quarter 2010 Results
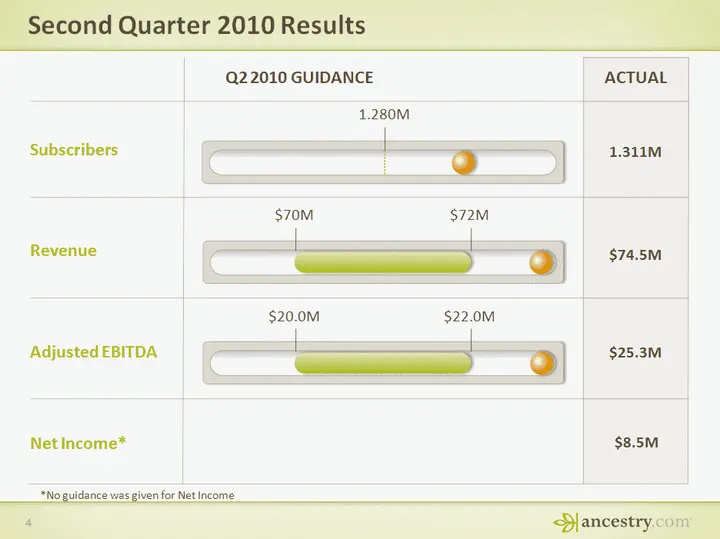
$20.0M $22.0M Second Quarter 2010 Results 4 Q2 2010 GUIDANCE ACTUAL Revenue Adjusted EBITDA 1.280M $25.3M $70M $74.5M Subscribers 1.311M $72M Net Income* $8.5M *No guidance was given for Net Income
Slide 5: Paid Subscribers: Consistent and Strong Subscriber Growth
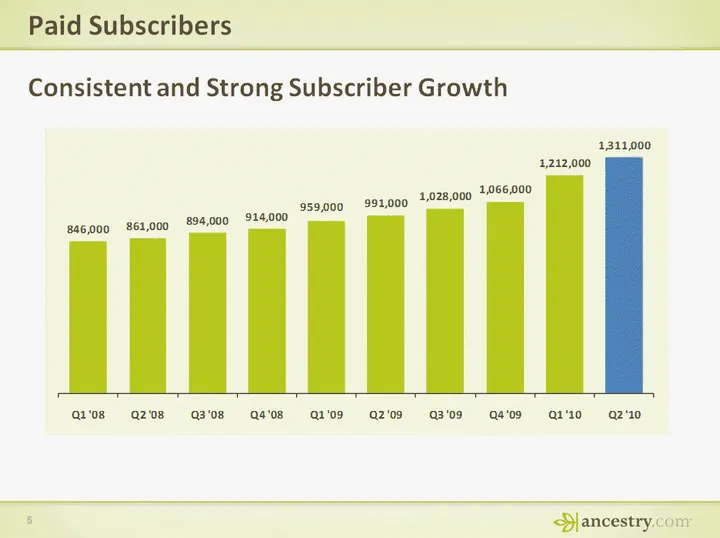
5 Paid Subscribers Consistent and Strong Subscriber Growth
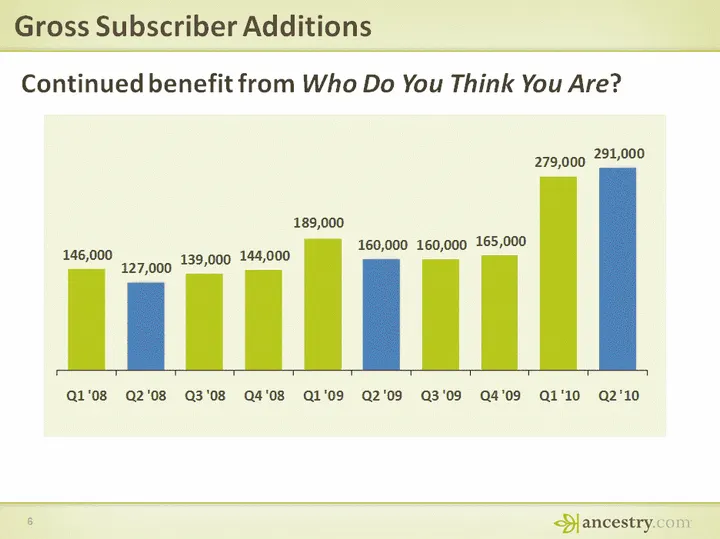
Slide 6: Gross Subscriber Additions
6 Gross Subscriber Additions Continued benefit from Who Do You Think You Are?
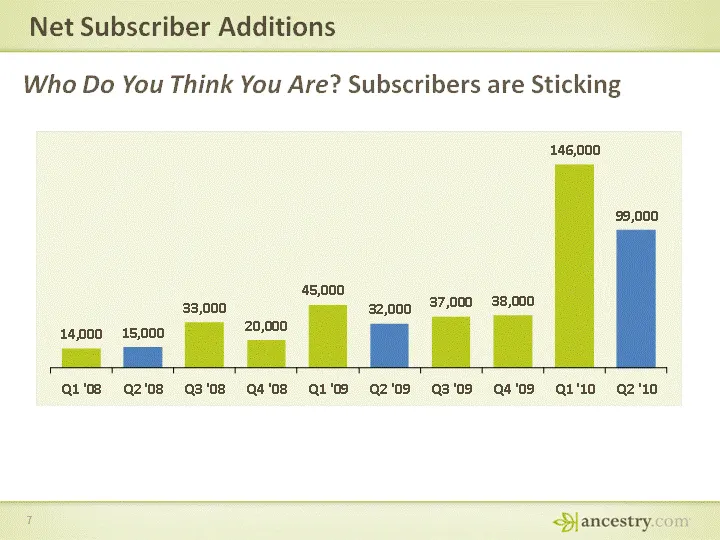
Slide 7: Net Subscriber Additions
7 Net Subscriber Additions Who Do You Think You Are? Subscribers are Sticking
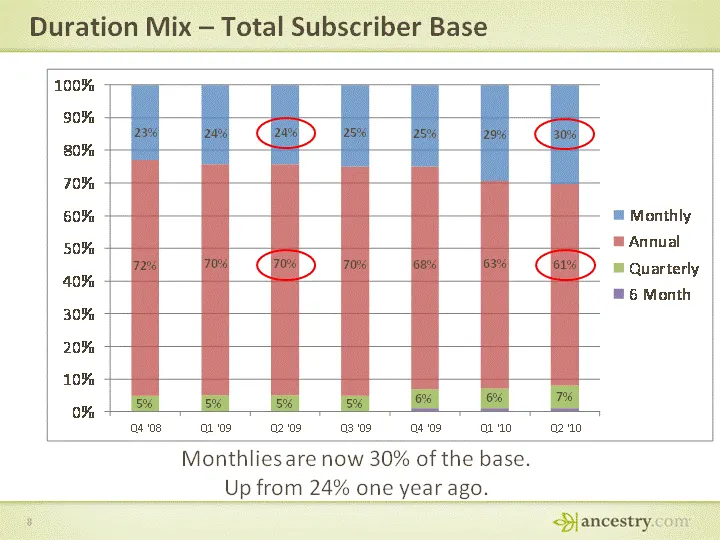
Slide 8: Duration Mix - Total Subscriber Base
Duration Mix - Total Subscriber Base 8 Monthlies are now 30% of the base. Up from 24% one year ago. 23% 25% 25% 24% 24% 30% 29% 63% 68% 70% 70% 70% 72% 61% 7% 6% 6% 5% 5% 5% 5%
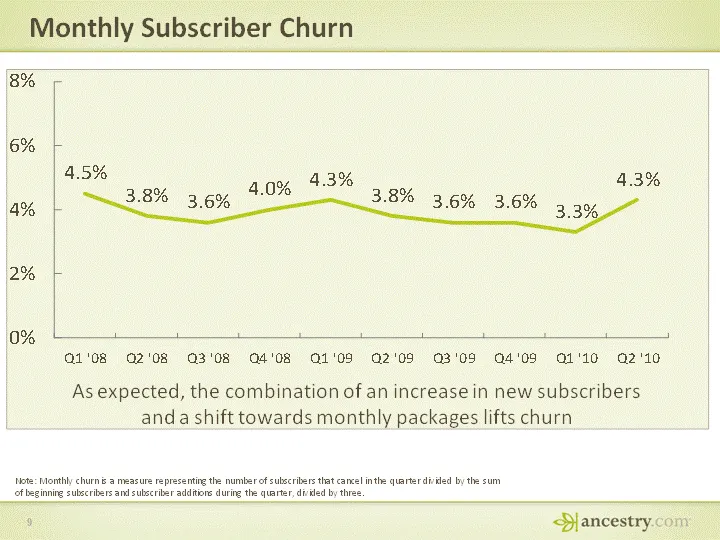
Slide 9: Monthly Subscriber Churn
Monthly Subscriber Churn 9 Note: Monthly churn is a measure representing the number of subscribers that cancel in the quarter divided by the sum of beginning subscribers and subscriber additions during the quarter, divided by three. As expected, the combination of an increase in new subscribers and
Slide 10: Subscriber Acquisition Cost Within Range
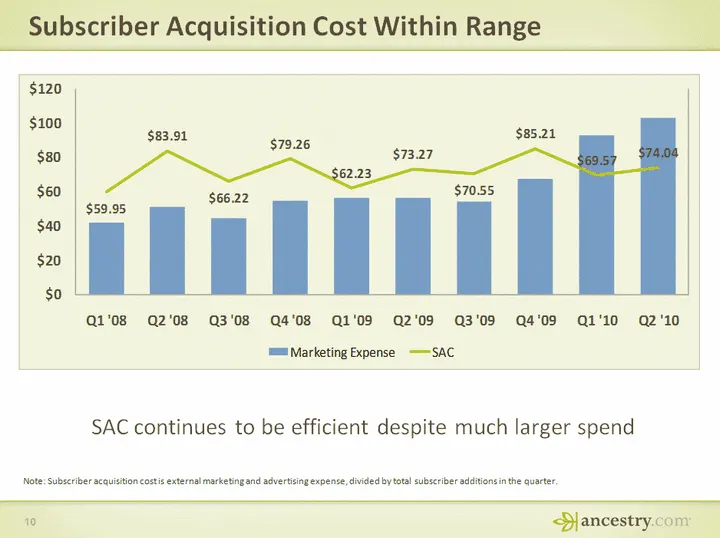
Subscriber Acquisition Cost Within Range 10 Note: Subscriber acquisition cost is external marketing and advertising expense, divided by total subscriber additions in the quarter. SAC continues to be efficient despite much larger spend
Slide 11: Selected Financial Data
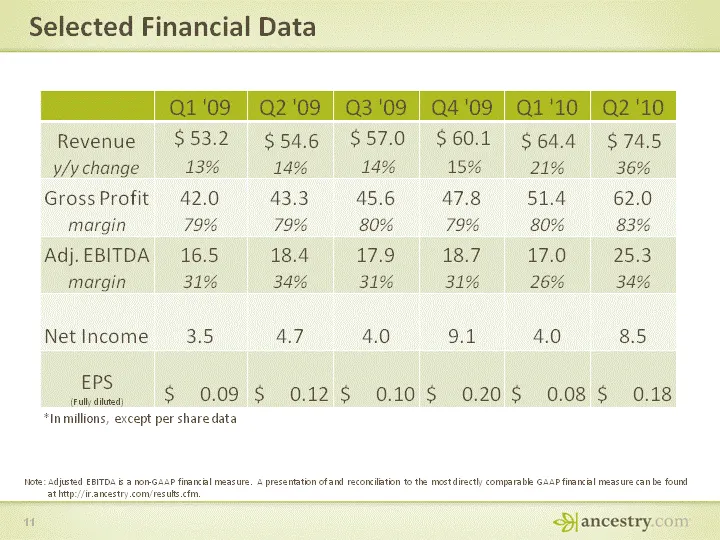
Selected Financial Data 11 Q1 '09 Q2 '09 Q3 '09 Q4 '09 Q1 '10 Q2 '10 Revenuey/y change $ 53.2 13% $ 54.614% $ 57.0 14% $ 60.1 15% $ 64.421% $ 74.536% Gross Profitmargin 42.079% 43.379% 45.680% 47.879% 51.480% 62.083% Adj. EBITDAmargin 16.531% 18.434% 17.931% 18.731% 17.026% 25.334% Net Income 3.5 4.
Slide 12: Business Outlook
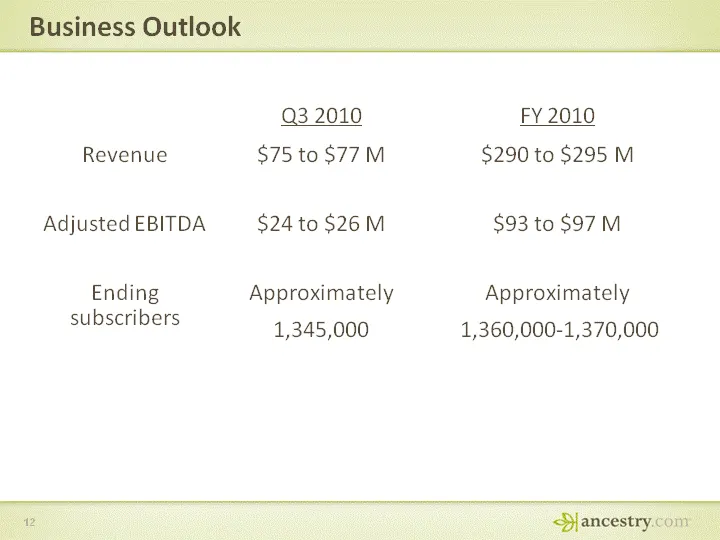
Business Outlook Business Outlook 12
Source: SEC EDGAR · 8-K filed Jul 29, 2010
More decks from Ancestry.com Inc
 Corporate Update (February 2015)21 slides · Feb 24, 2015
 Q2 2012 Earnings Presentation13 slides · Jul 25, 2012
 Corporate Update (July 2012)9 slides · Jul 25, 2012
 Q1 2012 Earnings Presentation13 slides · Apr 25, 2012
 Q4 2011 Earnings Presentation13 slides · Feb 15, 2012
 Q3 2011 Earnings Presentation13 slides · Oct 26, 2011