Meadowbrook Insurance Group Inc
Meadowbrook Insurance — Investor Day (November 2005)
32 slides from Meadowbrook Insurance's investor day presentation, Nov 30, 2005
Slide 1: 2005 Investor Conference
2005 Investor Conference November 30, 2005
Slide 2: Forward-Looking Statements
Forward-Looking Statements This presentation may include forward-looking statements, such as anticipated financial performance, capital structure and other financial items, statements on our plans and objectives, statements of future economic performance, and assumptions underlying the statements re
Slide 3: Meadowbrook Insurance Group
Meadowbrook Insurance Group We are a specialty risk management company providing solutions for agents, brokers, professional and trade associations, pools, trusts, and insureds of all sizes.
Slide 4: Meadowbrook Capital Raising Initiatives
Meadowbrook Capital Raising Initiatives 1995: Initial Public Offering (NYSE: MIG) raises $44.0 million Embarks on acquisition and growth strategy 2002: Recapitalization $60.5 million raised in secondary public offering Strengthening of balance sheet, reduction of debt, achieves rating upgrade 2003 -
Slide 5: Deployment of Capital
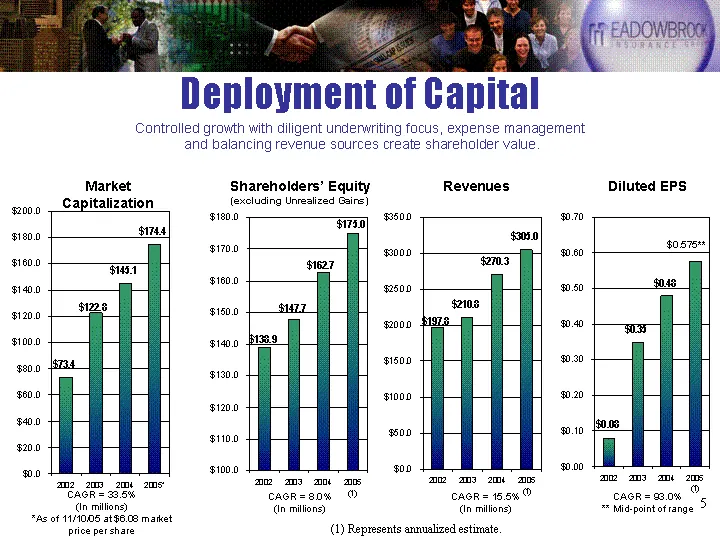
Deployment of Capital 2002 2003 2004 2005* Market Capitalization 73.4 122.8 145.1 174.4 2002 2003 2004 2005 (1) Shareholders' Equity 138.922 147.654 162.682 175 2002 2003 2004 2005 (1) EPS 0.08 0.35 0.48 0.575 Market Capitalization Shareholders' Equity (excluding Unrealized Gains) Diluted EPS CAGR =
Slide 6: A.M. Best Rating Statements
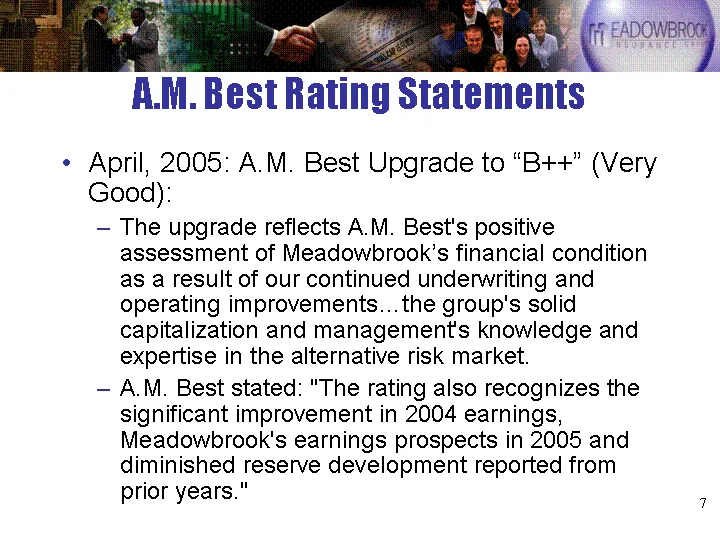
A.M. Best Rating Statements April, 2005: A.M. Best Upgrade to "B++" (Very Good): The upgrade reflects A.M. Best's positive assessment of Meadowbrook's financial condition as a result of our continued underwriting and operating improvements...the group's solid capitalization and management's knowledg
Slide 7: Revenue Sources: Fees and Commissions
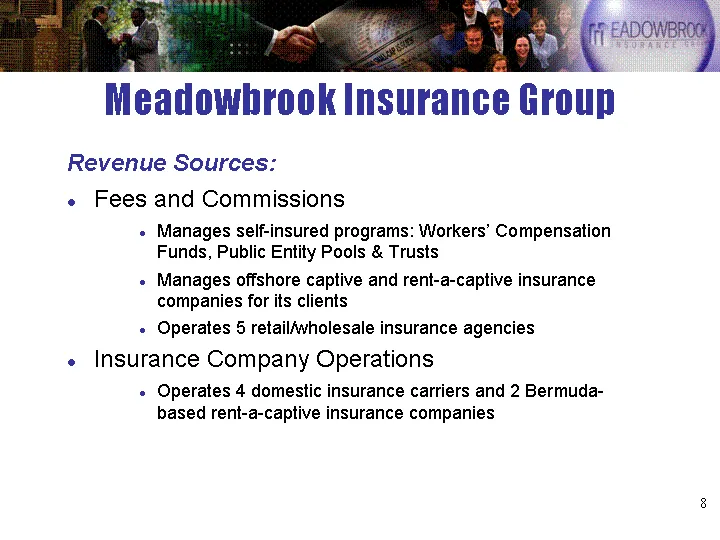
Meadowbrook Insurance Group Revenue Sources: Fees and Commissions Manages self-insured programs: Workers' Compensation Funds, Public Entity Pools & Trusts Manages offshore captive and rent-a-captive insurance companies for its clients Operates 5 retail/wholesale insurance agencies Insurance Company
Slide 8: Full Service Backroom Capabilities
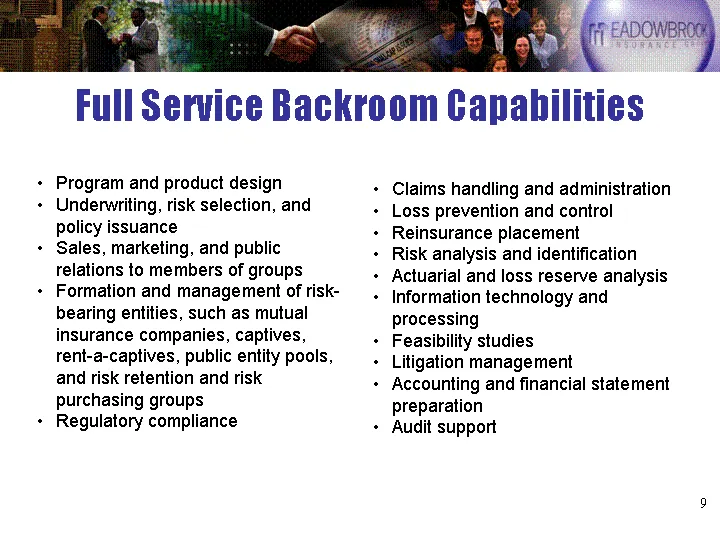
Full Service Backroom Capabilities Program and product design Underwriting, risk selection, and policy issuance Sales, marketing, and public relations to members of groups Formation and management of risk- bearing entities, such as mutual insurance companies, captives, rent-a-captives, public entity
Slide 9: Revenue Sources
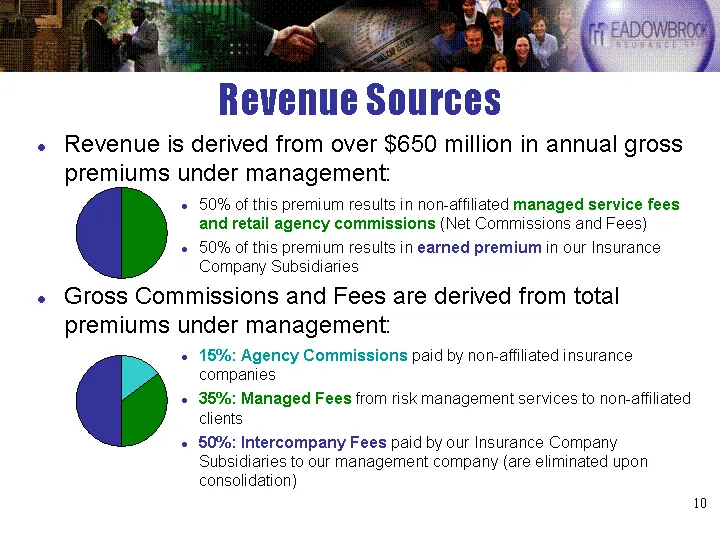
Revenue Sources Revenue is derived from over $650 million in annual gross premiums under management: 50% of this premium results in non-affiliated managed service fees and retail agency commissions (Net Commissions and Fees) 50% of this premium results in earned premium in our Insurance Company Subs
Slide 10: Corporate Structure and Revenue Sources
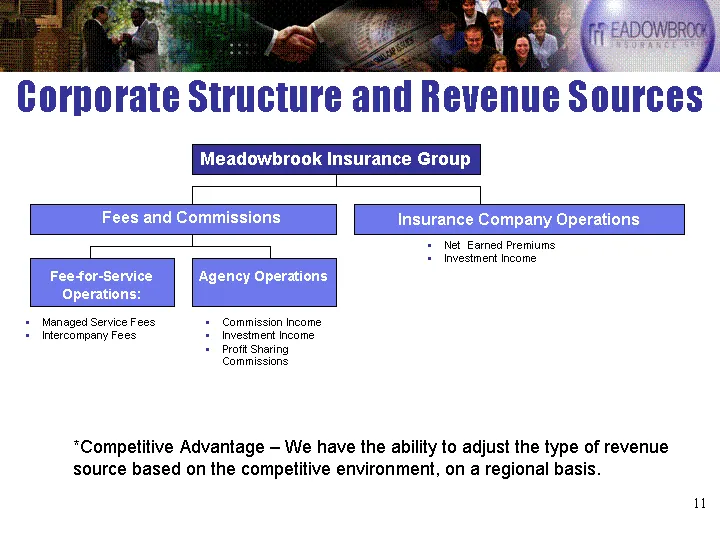
Corporate Structure and Revenue Sources Meadowbrook Insurance Group Insurance Company Operations Fees and Commissions Fee-for-Service Operations: Agency Operations Net Earned Premiums Investment Income Managed Service Fees Intercompany Fees Commission Income Investment Income Profit Sharing Commissi
Slide 11: Corporate Strategy
On a long-term basis, our key financial target is to achieve a return on equity within the 14 - 16% range. Our corporate strategy includes a balance in the mix of business, increasing fee-based revenue, and increasing productivity and efficiency of the operations. Corporate Strategy
Slide 12: Revenue Growth Strategy
We have balanced revenue sources (agency commissions, fee-for-service, and insurance premiums). Organic growth - all revenue sources Add new members to existing programs Implement new insurance and managed programs Add new agency clients Placement of risks with strategic underwriting partners based
Slide 13: Productivity and Efficiency
We have the ability to leverage fixed costs. Corporate culture fosters improved productivity on a continuous basis through the integration of training, technology investments, and other process improvements. Productivity and Efficiency
Slide 14: Additional Competitive Advantages
Additional Competitive Advantages Full service regional offices - local knowledge History of specialty underwriting expertise Strong long-term relationships with constituents Thorough due diligence process and new business review Efficient web based business processing
Slide 15: Regionally Focused Offices
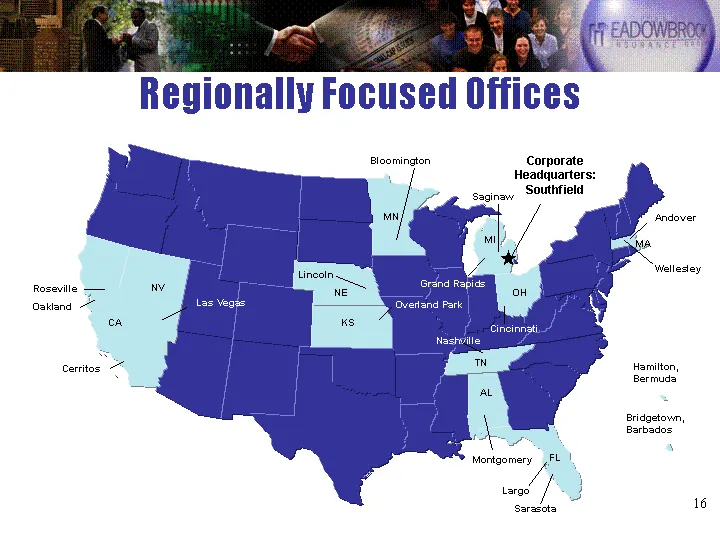
Regionally Focused Offices CA NV KS MN MA FL AL MI TN Corporate Headquarters: Southfield Grand Rapids Saginaw Lincoln Oakland Las Vegas Montgomery Overland Park Cerritos Roseville Sarasota Hamilton, Bermuda Nashville Andover Bridgetown, Barbados Bloomington Largo Cincinnati OH NE Wellesley

Slide 16: Financial Section
Financial Section a
Slide 17: Controlled Growth of Premium
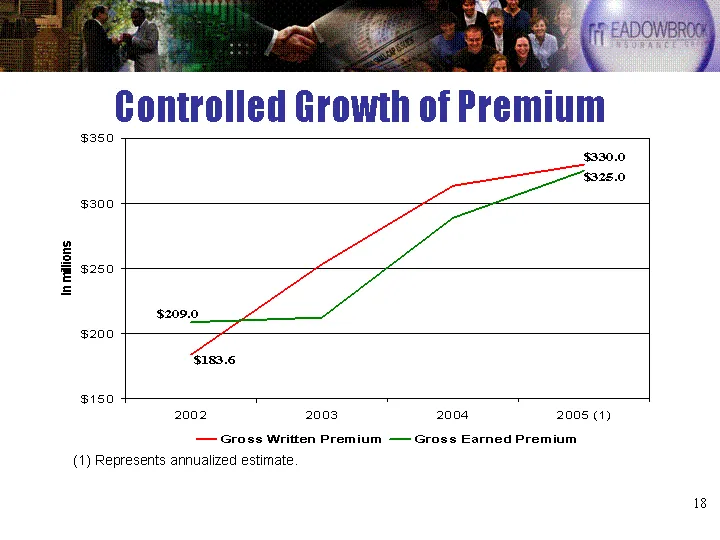
2002 2003 2004 2005 (1) Gross Written Premium 183.637 253.28 313.493 330 Gross Earned Premium 208.962 212.28 288.868 325 Controlled Growth of Premium (1) Represents annualized estimate.
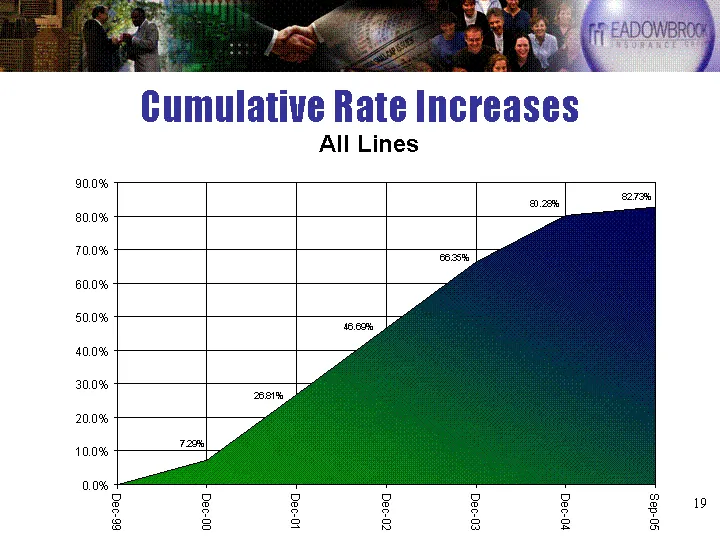
Slide 18: Cumulative Rate Increases
Cumulative Rate Increases 12/30/1995 11/30/1996 11/30/1997 12/30/1998 12/30/1999 12/30/2000 9/29/2001 WC + AOL 0 0.0729 0.2681 0.4669 0.6635 0.8028 0.8273 All Lines
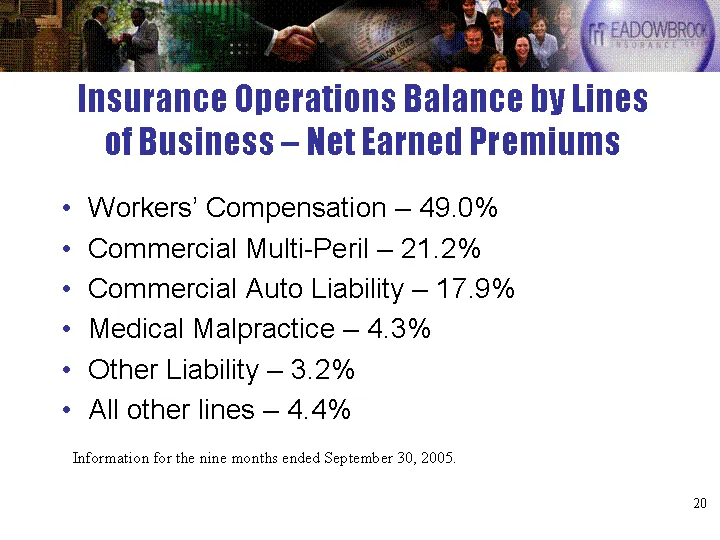
Slide 19: Insurance Operations Balance by Lines of Business
Insurance Operations Balance by Lines of Business - Net Earned Premiums Workers' Compensation - 49.0% Commercial Multi-Peril - 21.2% Commercial Auto Liability - 17.9% Medical Malpractice - 4.3% Other Liability - 3.2% All other lines - 4.4% Information for the nine months ended September 30, 2005.
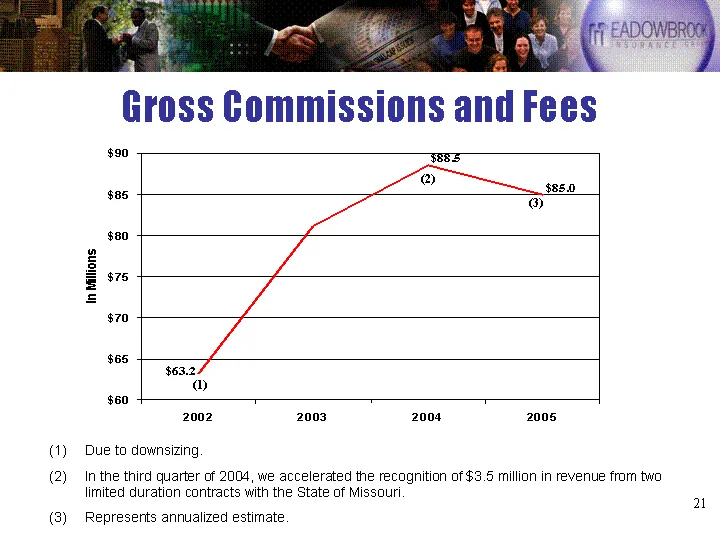
Slide 20: Gross Commissions and Fees
Gross Commissions and Fees Due to downsizing. In the third quarter of 2004, we accelerated the recognition of $3.5 million in revenue from two limited duration contracts with the State of Missouri. Represents annualized estimate. 2002 2003 2004 2005 Annual Gross Commissions & Fees 63.2 81.1 88.5 85
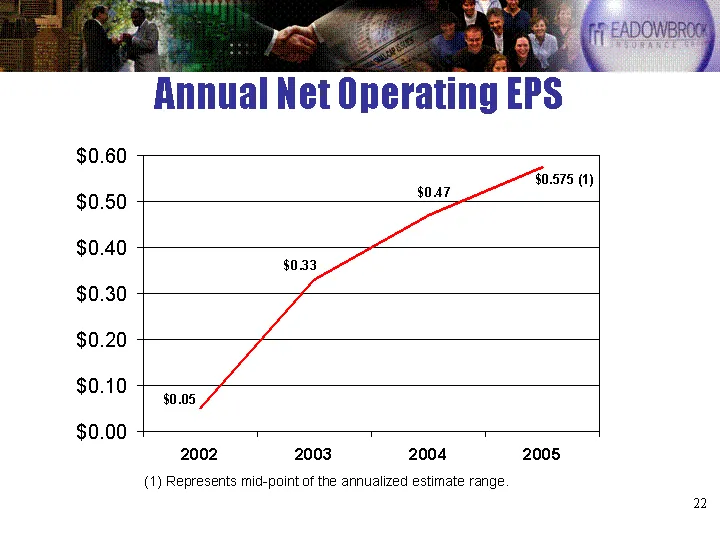
Slide 21: Annual Net Operating EPS
Annual Net Operating EPS 2002 2003 2004 2005 Net Operating Income 0.05 0.33 0.47 0.575 (1) Represents mid-point of the annualized estimate range. $0.575 (1)
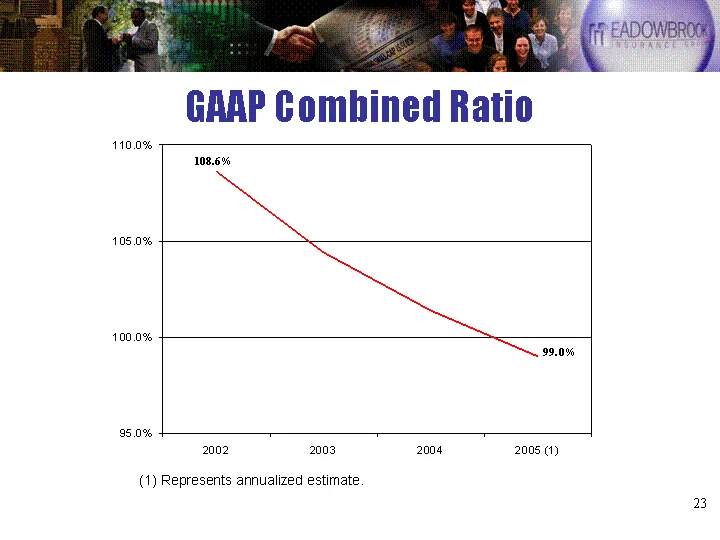
Slide 22: GAAP Combined Ratio
2002 2003 2004 2005 (1) GAAP Combined Ratio 1.086 1.044 1.014 0.99 GAAP Combined Ratio (1) Represents annualized estimate.
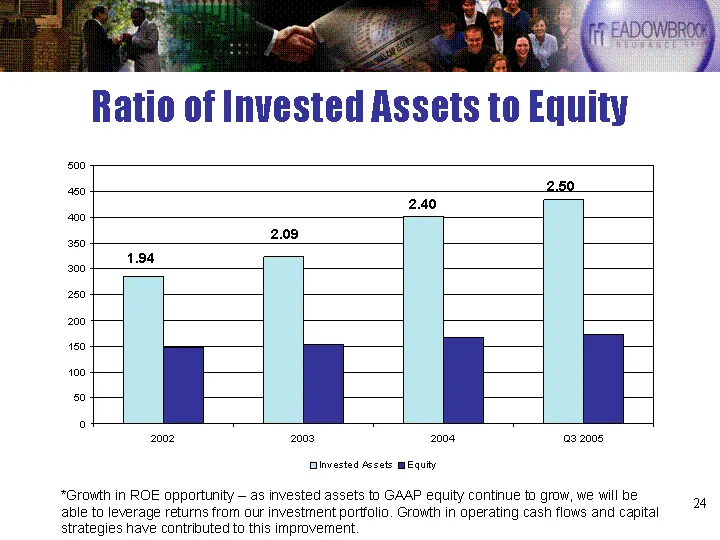
Slide 23: Ratio of Invested Assets to Equity
Ratio of Invested Assets to Equity 2002 2003 2004 Q3 2005 Invested Assets 286.05 324.235 402.156 434.147 Equity 147.395 155.113 167.51 173.954 *Growth in ROE opportunity - as invested assets to GAAP equity continue to grow, we will be able to leverage returns from our investment portfolio. Growth in
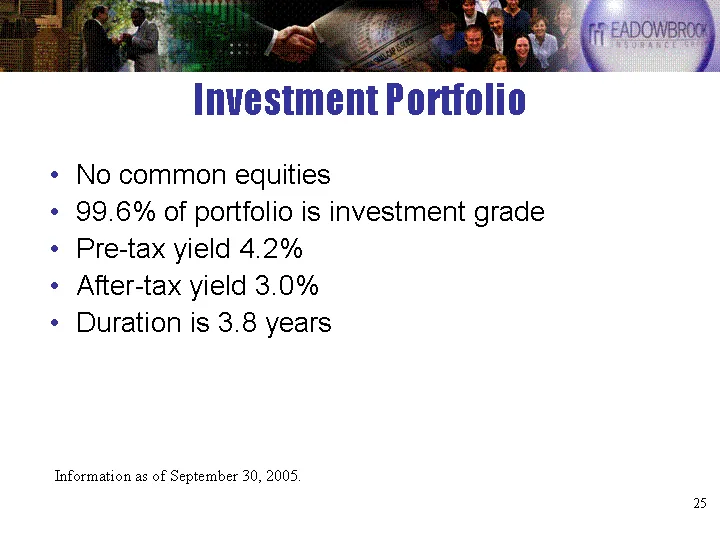
Slide 24: Investment Portfolio
No common equities 99.6% of portfolio is investment grade Pre-tax yield 4.2% After-tax yield 3.0% Duration is 3.8 years Investment Portfolio Information as of September 30, 2005.
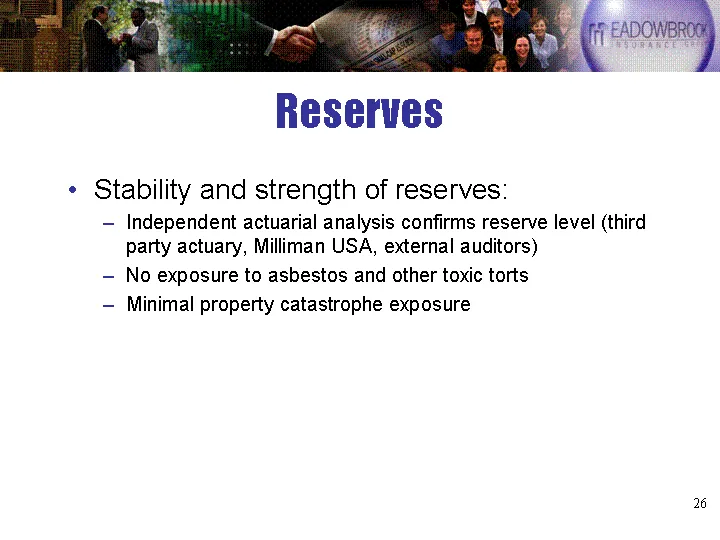
Slide 25: Reserves
Reserves Stability and strength of reserves: Independent actuarial analysis confirms reserve level (third party actuary, Milliman USA, external auditors) No exposure to asbestos and other toxic torts Minimal property catastrophe exposure

Slide 26: Current Outlook
Current Outlook
Slide 27: Current Market Conditions
Current Market Conditions Continued demand for alternative risk/ specialty program underwriters Impact of previous years rate increases have improved profitability and quality of underwritten business Rising interest rates increase ROE Modest downward pressure on insurance pricing Incremental indust
Slide 28: Guidance
Guidance Based upon the results of the first nine months of 2005, we anticipate the full year 2005 earnings to be between $0.57 and $0.58 per share. Our full year 2006 anticipated earnings are expected to grow by approximately 15% to between $0.64 and $0.68 per share. Our 2006 outlook includes a tar
Slide 29: Creating Shareholder Value
Creating Shareholder Value Sustainable, competitive advantage: Program specialist Select jurisdictions - regional focus, local knowledge Diverse distribution channels Recognized leader in alternative risk management Efficient web based business processing Controlled and disciplined underwriting
Slide 30: Creating Shareholder Value: Balanced Revenue Base
Creating Shareholder Value Balanced Revenue Base Managed Fees Commissions Underwriting Income Investment Income Continued Opportunity to Leverage Fixed Costs
Slide 31: Creating Shareholder Value: Customized Solutions
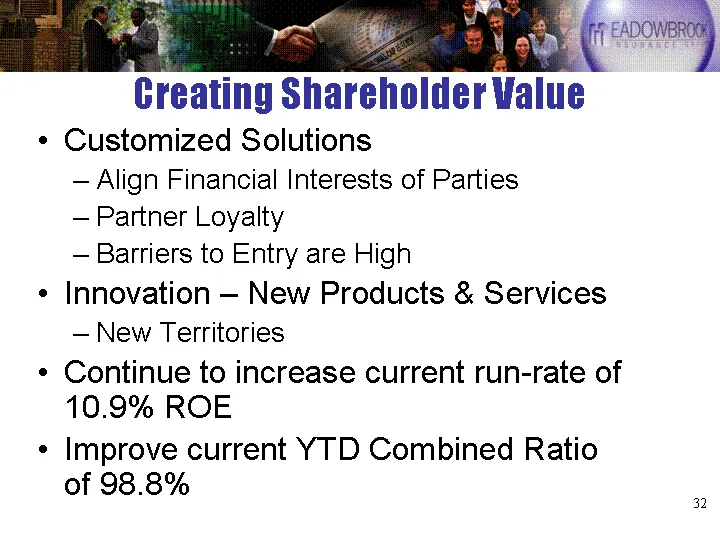
Creating Shareholder Value Customized Solutions Align Financial Interests of Parties Partner Loyalty Barriers to Entry are High Innovation - New Products & Services New Territories Continue to increase current run-rate of 10.9% ROE Improve current YTD Combined Ratio of 98.8%
Slide 32: MIG Fact Sheet
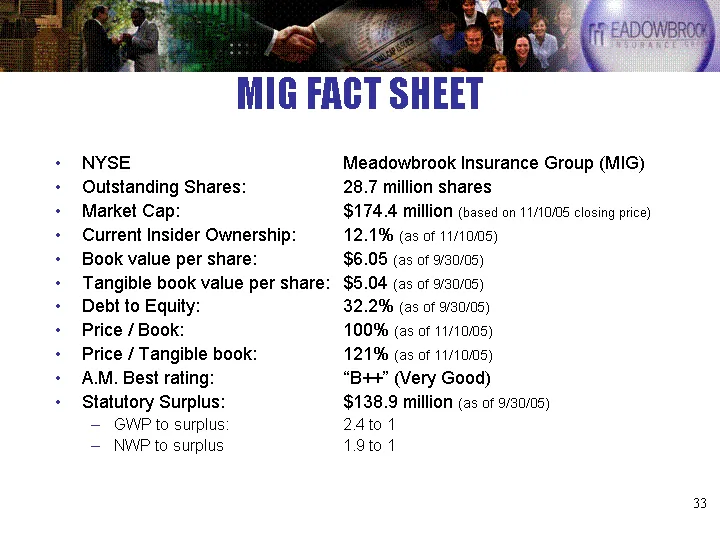
MIG FACT SHEET NYSE Meadowbrook Insurance Group (MIG) Outstanding Shares: 28.7 million shares Market Cap: $174.4 million (based on 11/10/05 closing price) Current Insider Ownership: 12.1% (as of 11/10/05) Book value per share: $6.05 (as of 9/30/05) Tangible book value per share: $5.04 (as of 9/30/05
Source: SEC EDGAR · 8-K filed Nov 30, 2005
More decks from Meadowbrook Insurance Group Inc
 Q3 2014 Earnings Presentation26 slides · Nov 18, 2014
 Q3 2014 Earnings Presentation19 slides · Nov 18, 2014
 Q2 2014 Earnings Presentation21 slides · Aug 28, 2014
 Q2 2014 Earnings Presentation27 slides · Aug 28, 2014
 Investor Presentation (June 2014)31 slides · Jun 3, 2014
 Q1 2014 Earnings Presentation21 slides · Jun 3, 2014