Firstmerit — Barclays European Financial Services Conference 2012
28 slides from Firstmerit's conference presentation, May 15, 2012
Slide 1: Barclays European Financial Services Conference, London
London, England May 15, 2012 Barclays European Financial Services Conference
Slide 2: Forward-looking Statement Disclosure
This presentation contains forward-looking statements relating to present or future trends or factors affecting the banking industry, and specifically the financial condition and results of operations, including without limitation, statements relating to the earnings outlook of the Corporation, as w
Slide 3: The FirstMerit Opportunity
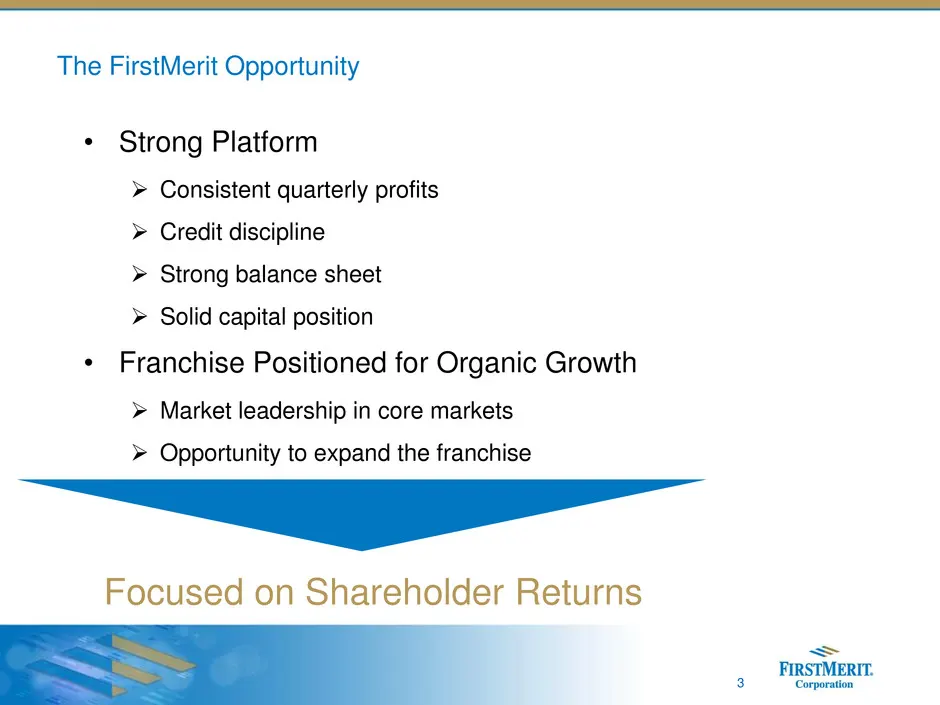
• Strong Platform Consistent quarterly profits Credit discipline Strong balance sheet Solid capital position • Franchise Positioned for Organic Growth Market leadership in core markets Opportunity to expand the franchise The FirstMerit Opportunity 3 Focused on Shareholder Returns
Slide 4: FirstMerit Overview
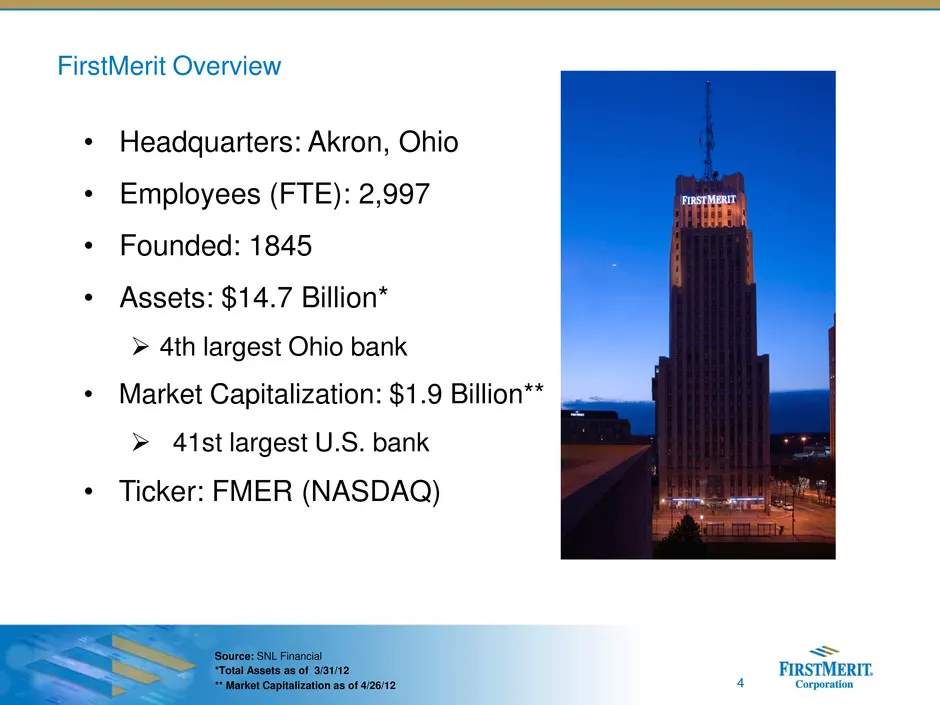
FirstMerit Overview • Headquarters: Akron, Ohio • Employees (FTE): 2,997 • Founded: 1845 • Assets: $14.7 Billion* 4th largest Ohio bank • Market Capitalization: $1.9 Billion** 41st largest U.S. bank • Ticker: FMER (NASDAQ) *Total Assets as of 3/31/12 ** Market Capitalization as of 4/26/12 Source
Slide 5: 1Q 2012 Highlights
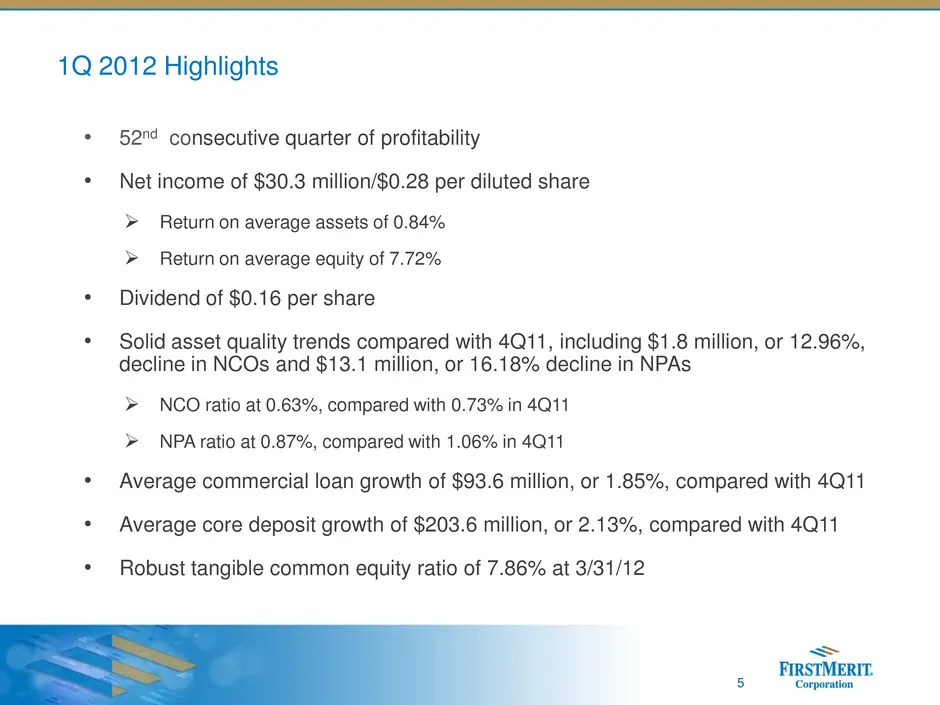
5 • 52nd consecutive quarter of profitability • Net income of $30.3 million/$0.28 per diluted share Return on average assets of 0.84% Return on average equity of 7.72% • Dividend of $0.16 per share • Solid asset quality trends compared with 4Q11, including $1.8 million, or 12.96%, decline in NCO
Slide 6: Chicago Expansion
> FIRSTMERIT. Chicago Expansion =~ => FIRSTMERIT. Ce -ati
Slide 7: Building a Strategic Franchise in Chicago
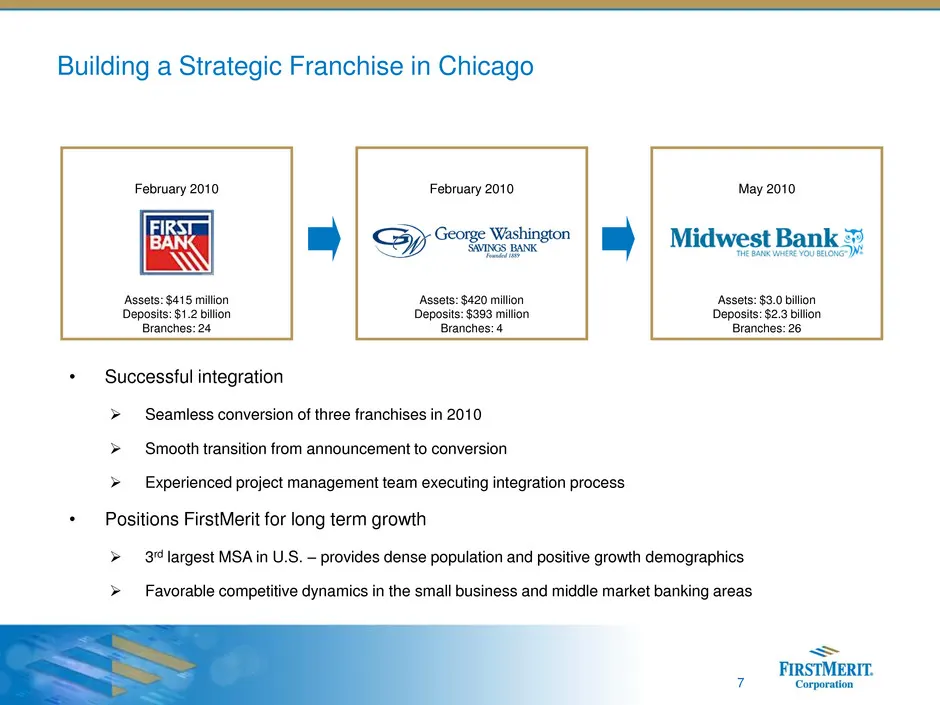
7 Assets: $415 million Deposits: $1.2 billion Branches: 24 February 2010 Assets: $420 million Deposits: $393 million Branches: 4 February 2010 Assets: $3.0 billion Deposits: $2.3 billion Branches: 26 May 2010 Building a Strategic Franchise in Chicago • Successful integration Seamless conversion of
Slide 8: Experienced Leadership Team with Chicago Roots
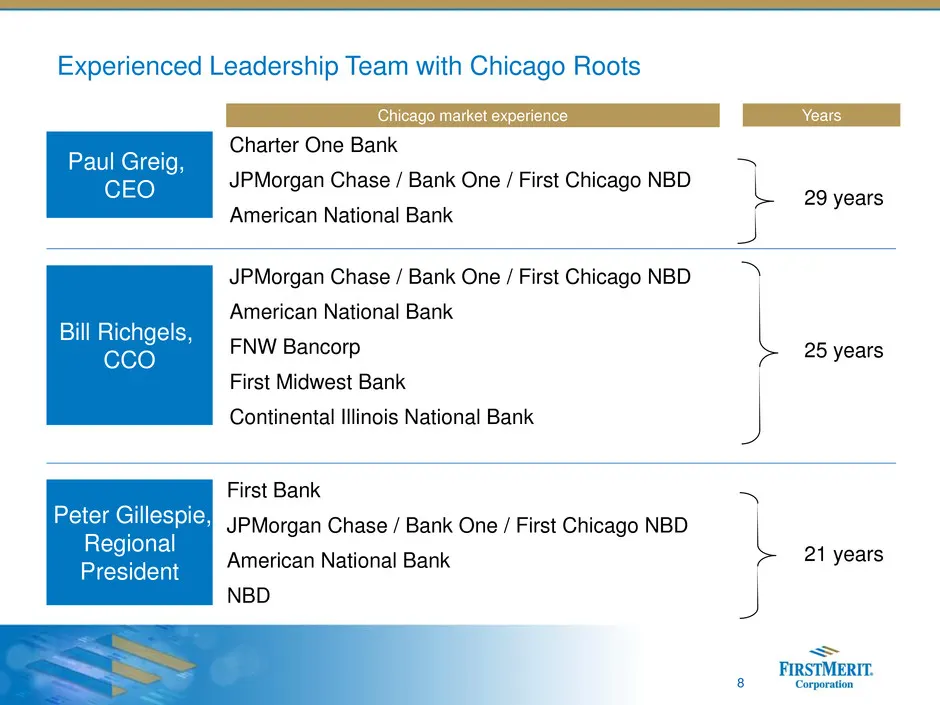
Paul Greig, CEO Bill Richgels, CCO Peter Gillespie, Regional President Chicago market experience Years JPMorgan Chase / Bank One / First Chicago NBD American National Bank FNW Bancorp First Midwest Bank Continental Illinois National Bank First Bank JPMorgan Chase / Bank One / First Chicago NBD Ameri
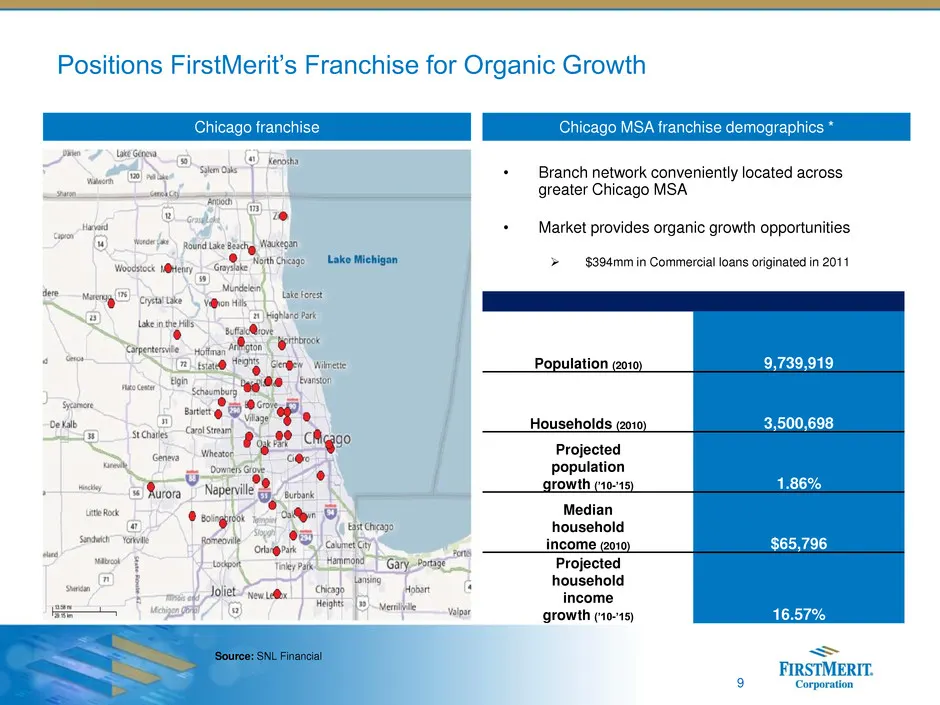
Slide 9: Positions FirstMerit's Franchise for Organic Growth
Chicago franchise Chicago MSA franchise demographics * Positions FirstMerit’s Franchise for Organic Growth • Branch network conveniently located across greater Chicago MSA • Market provides organic growth opportunities $394mm in Commercial loans originated in 2011 Population (2010) 9,739,919 House
Slide 10: FirstMerit Corporation
_— FIRSTMERIT. FIRSTMERIT ‘orporation
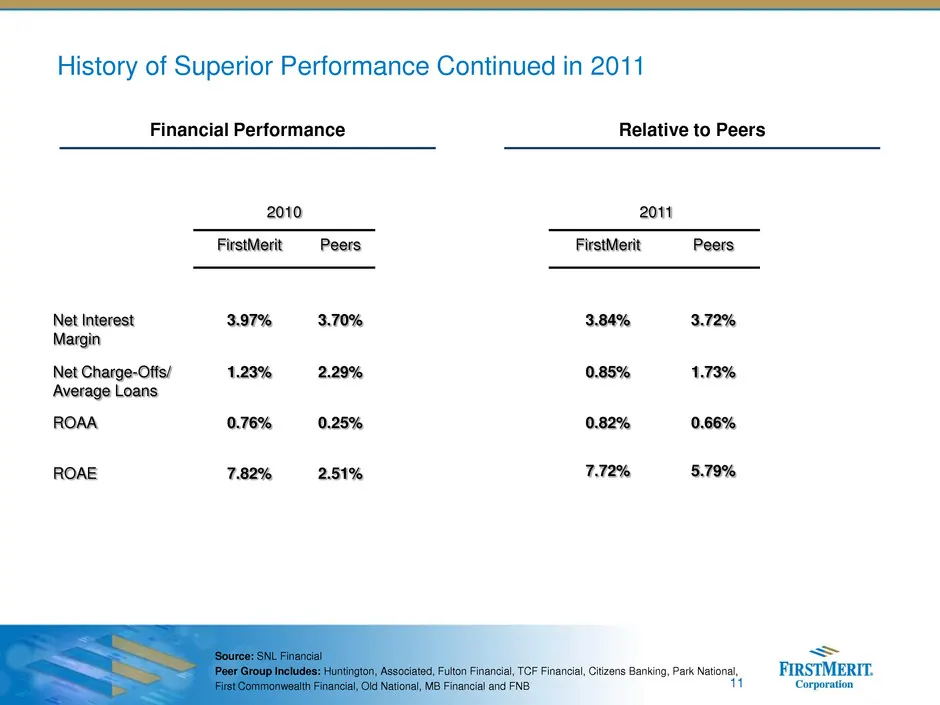
Slide 11: Financial Performance Relative to Peers
History of Superior Performance Continued in 2011 2011 FirstMerit Peers 3.84% 3.72% 0.85% 1.73% 0.82% 0.66% 7.72% 5.79% 2010 FirstMerit Peers Net Interest Margin 3.97% 3.70% Net Charge-Offs/ Average Loans 1.23% 2.29% ROAA 0.76% 0.25% ROAE 7.82% 2.51% Source: SNL Financial Peer Group Includes: Huntin
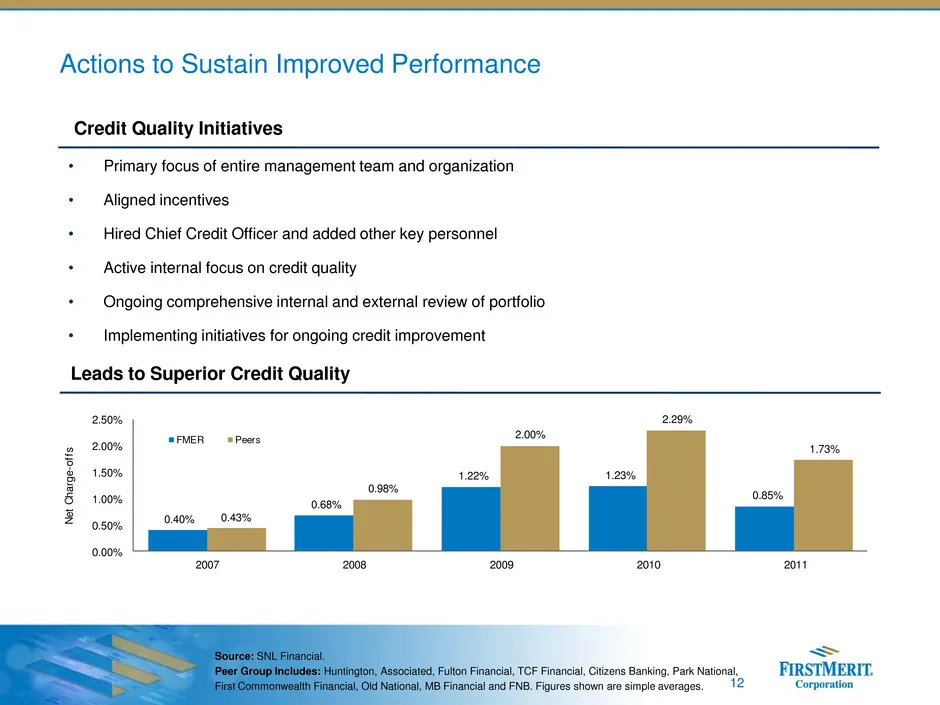
Slide 12: Credit Quality Initiatives Leads to Superior Credit Quality
12 • Primary focus of entire management team and organization • Aligned incentives • Hired Chief Credit Officer and added other key personnel • Active internal focus on credit quality • Ongoing comprehensive internal and external review of portfolio • Implementing initiatives for ongoing credit impr
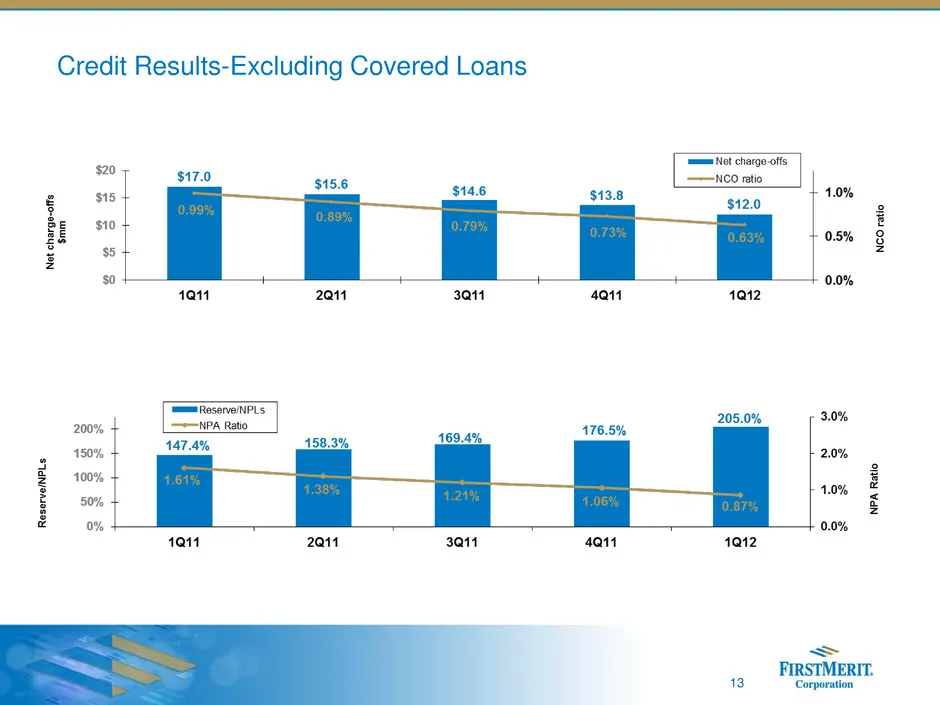
Slide 13: Credit Results-Excluding Covered Loans
13 Credit Results-Excluding Covered Loans
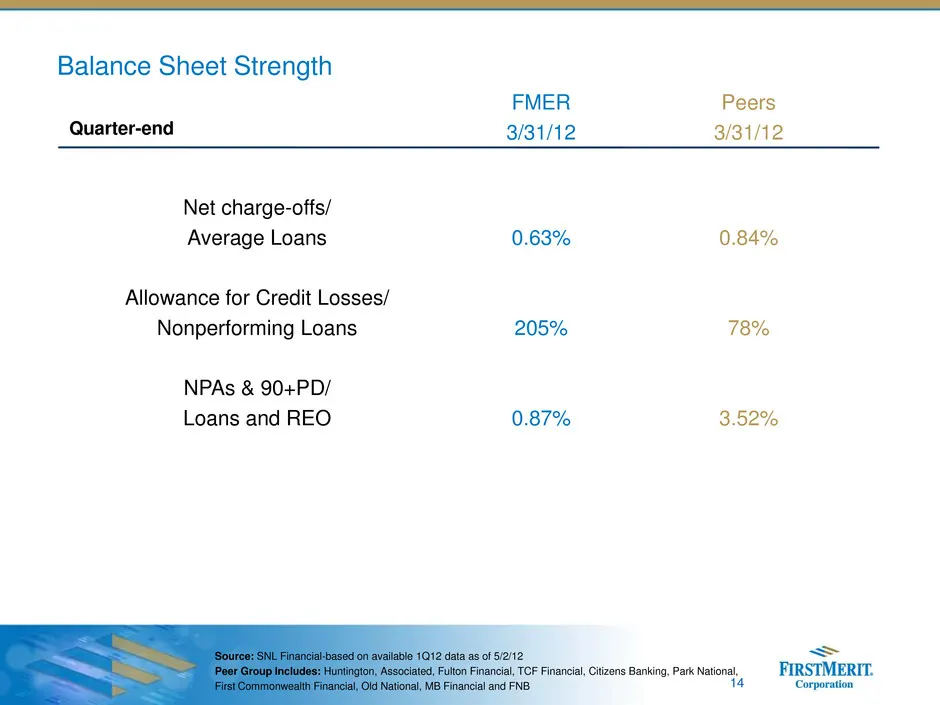
Slide 14: Balance Sheet Strength
FMER 3/31/12 Peers 3/31/12 Net charge-offs/ Average Loans Allowance for Credit Losses/ Nonperforming Loans NPAs & 90+PD/ Loans and REO 0.63% 205% 0.87% 0.84% 78% 3.52% Balance Sheet Strength Source: SNL Financial-based on available 1Q12 data as of 5/2/12 Peer Group Includes: Huntington, Associated,
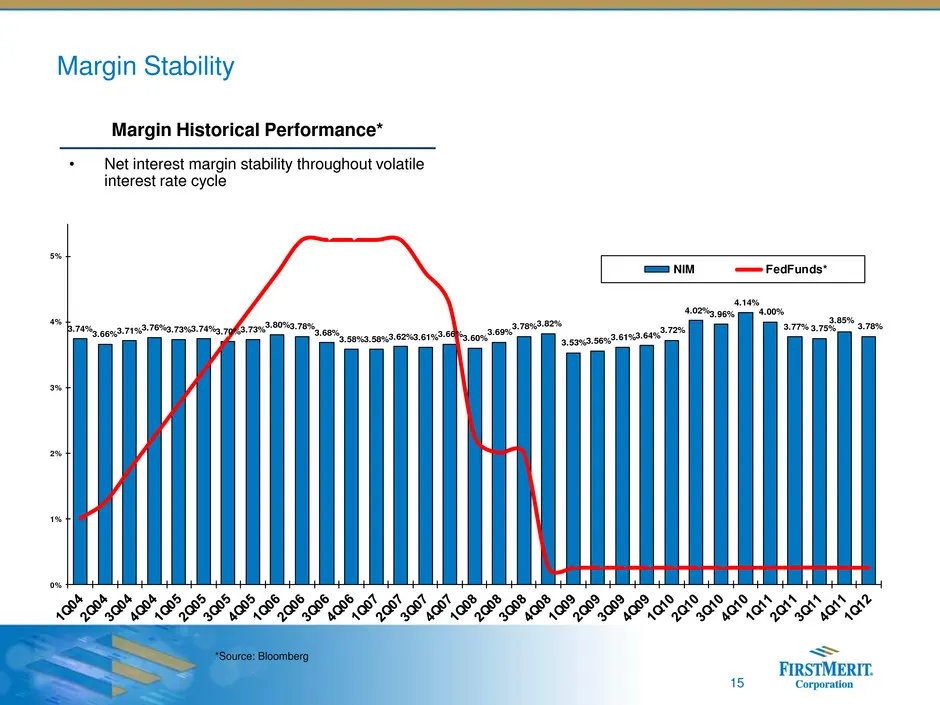
Slide 15: Margin Stability
3.74% 3.66%3.71% 3.76%3.73%3.74%3.70%3.73% 3.80%3.78% 3.68% 3.58%3.58%3.62%3.61% 3.66%3.60% 3.69% 3.78%3.82% 3.53%3.56% 3.61%3.64% 3.72% 4.02%3.96% 4.14% 4.00% 3.77% 3.75% 3.85% 3.78% 0% 1% 2% 3% 4% 5% NIM FedFunds* Margin Stability *Source: Bloomberg 15 Margin Historical Performance* • Net interest
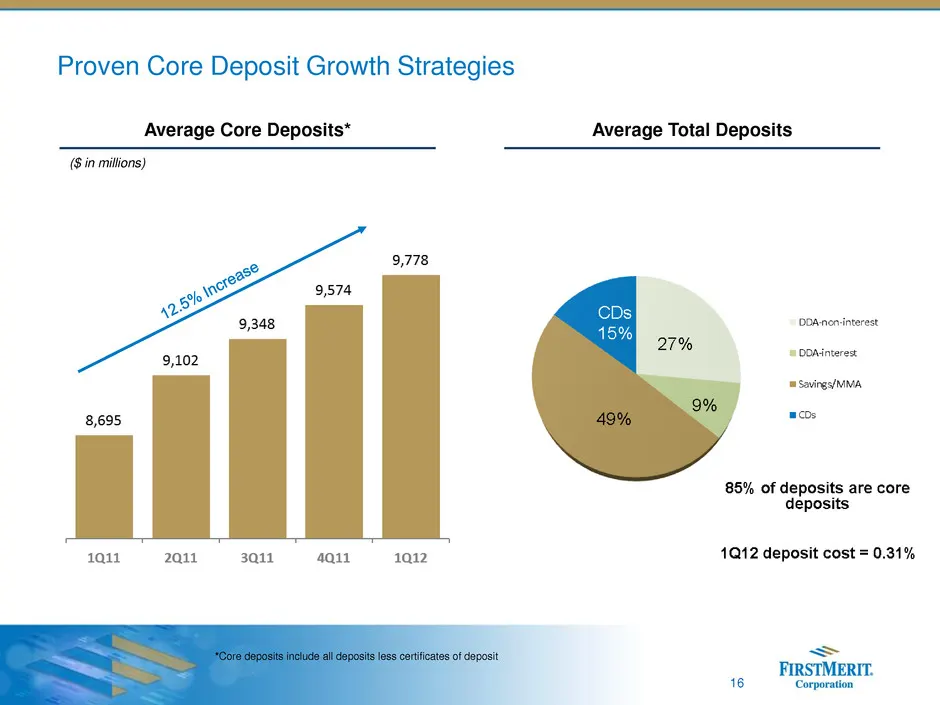
Slide 16: Proven Core Deposit Growth Strategies
16 Proven Core Deposit Growth Strategies Average Core Deposits* Average Total Deposits ($ in millions) *Core deposits include all deposits less certificates of deposit
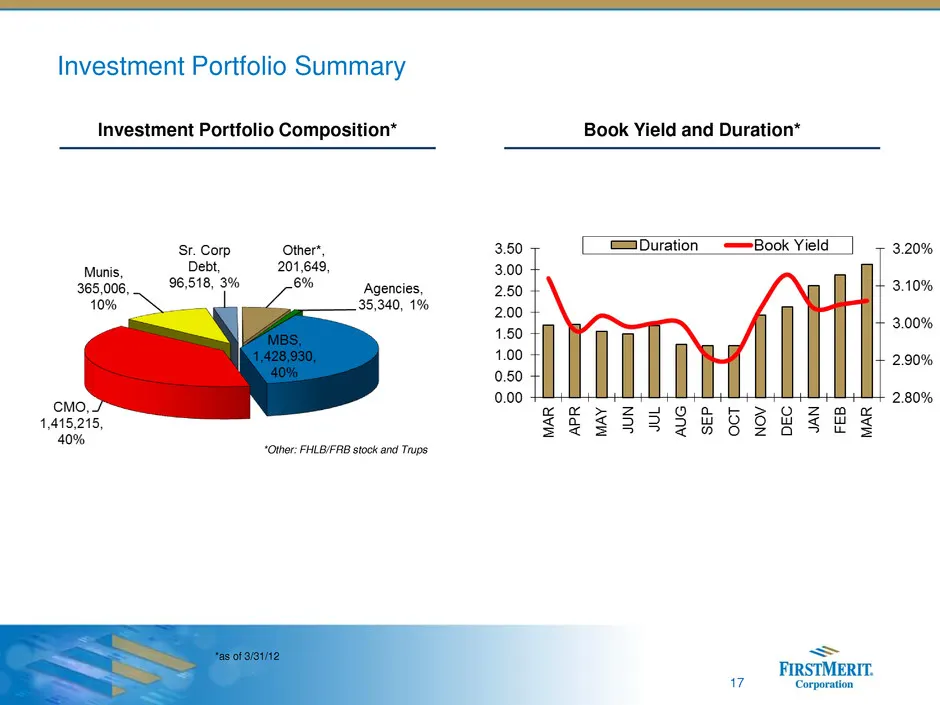
Slide 17: Investment Portfolio Summary
17 Investment Portfolio Summary Investment Portfolio Composition* Book Yield and Duration* *Other: FHLB/FRB stock and Trups *as of 3/31/12
Slide 18: FirstMerit Corporation
_— FIRSTMERIT. FIRSTMERIT ‘orporation
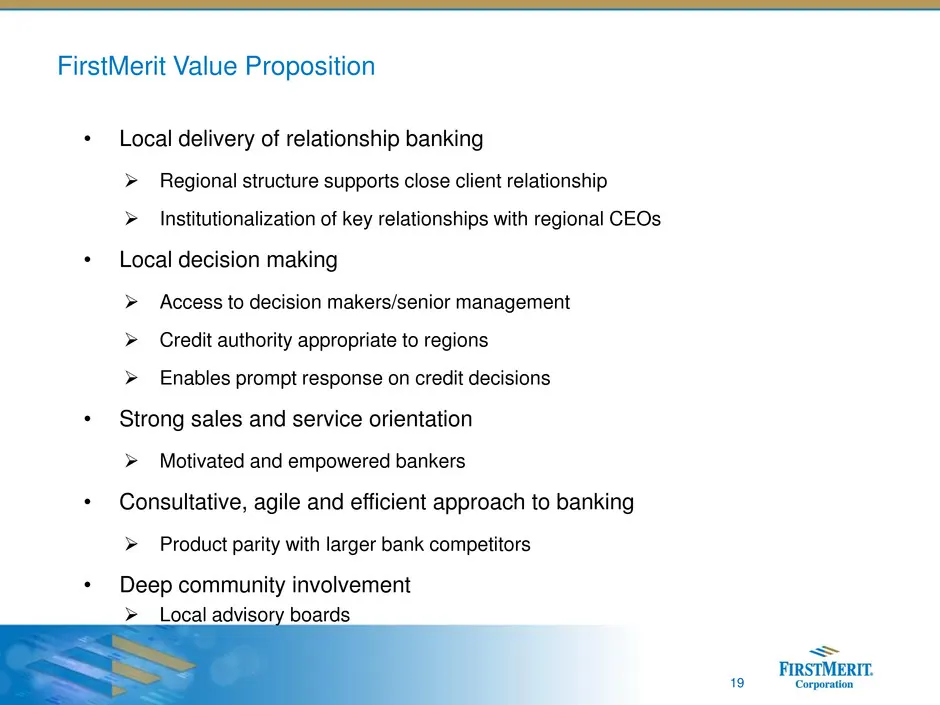
Slide 19: FirstMerit Value Proposition
FirstMerit Value Proposition • Local delivery of relationship banking Regional structure supports close client relationship Institutionalization of key relationships with regional CEOs • Local decision making Access to decision makers/senior management Credit authority appropriate to regions
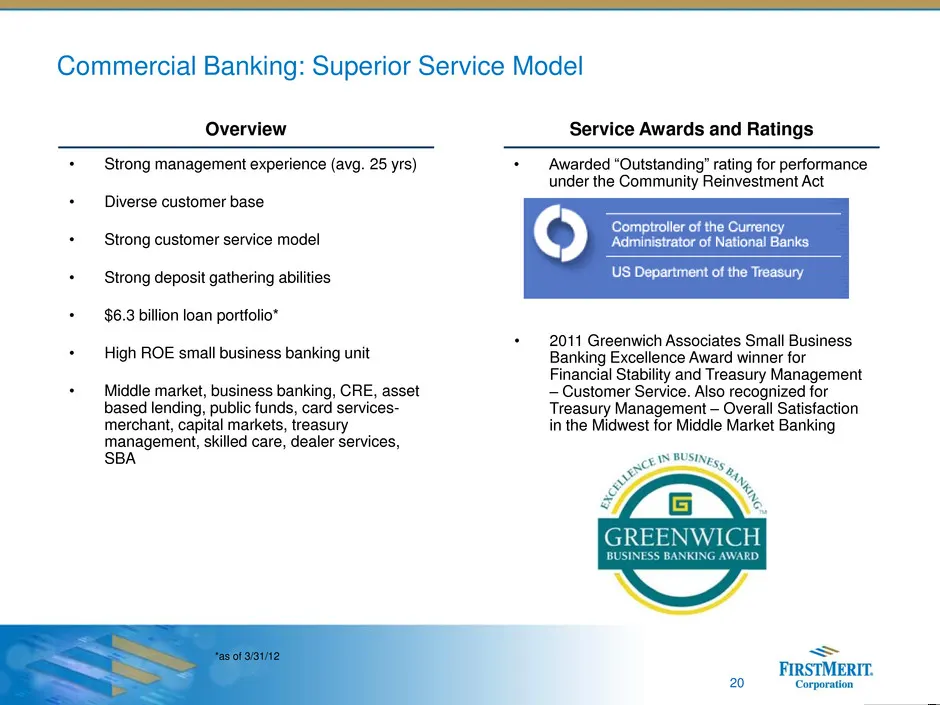
Slide 20: Commercial Banking: Superior Service Model
20 • Strong management experience (avg. 25 yrs) • Diverse customer base • Strong customer service model • Strong deposit gathering abilities • $6.3 billion loan portfolio* • High ROE small business banking unit • Middle market, business banking, CRE, asset based lending, public funds, card services-
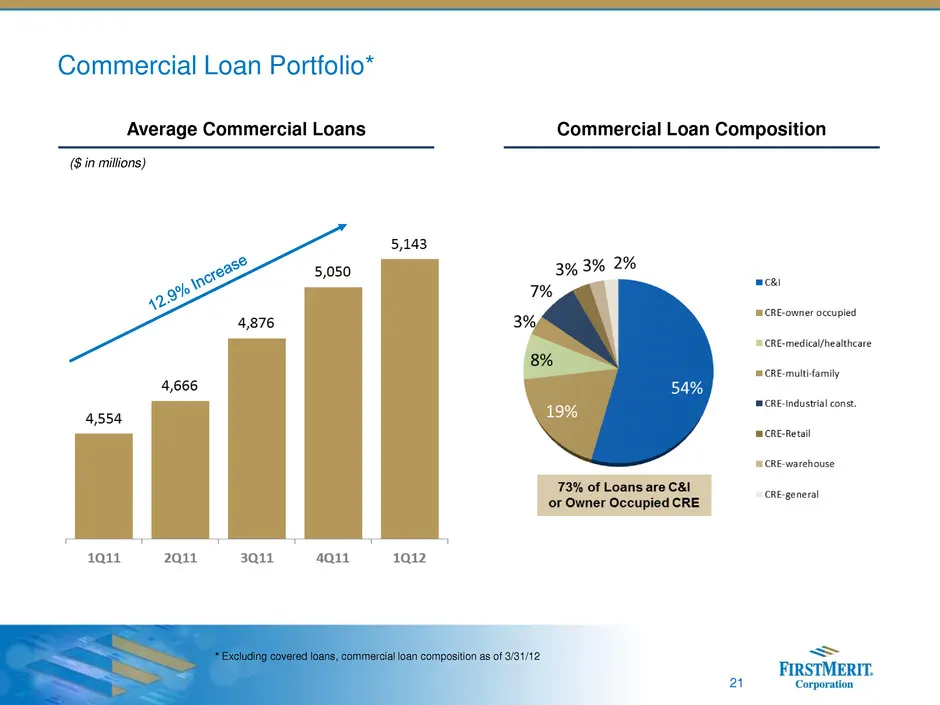
Slide 21: Commercial Loan Portfolio
21 Commercial Loan Portfolio* Average Commercial Loans Commercial Loan Composition ($ in millions) * Excluding covered loans, commercial loan composition as of 3/31/12
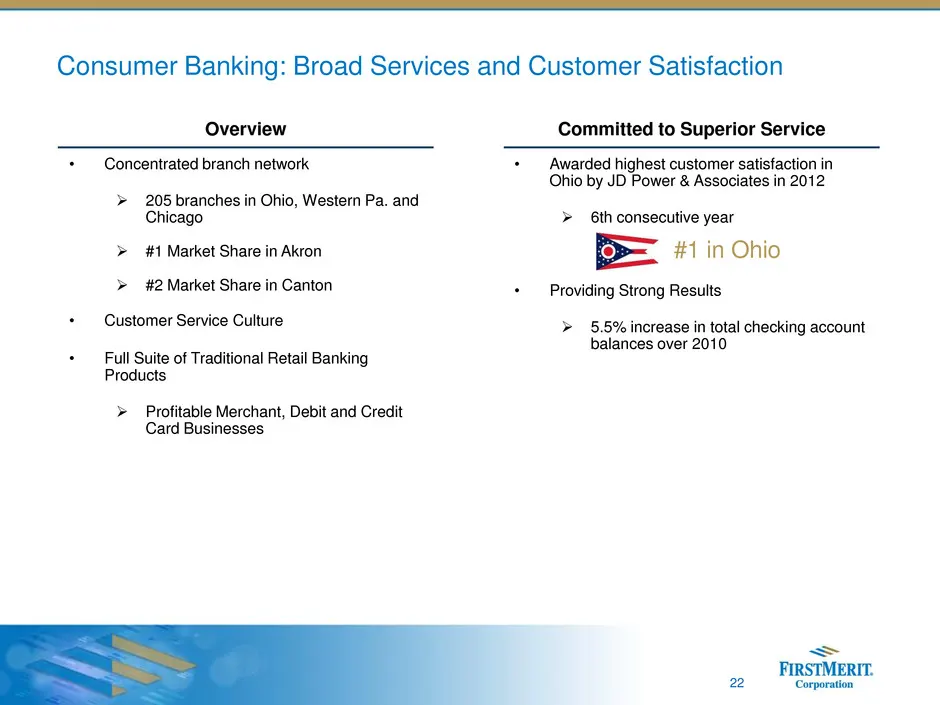
Slide 22: Consumer Banking: Broad Services and Customer Satisfaction
22 • Concentrated branch network 205 branches in Ohio, Western Pa. and Chicago #1 Market Share in Akron #2 Market Share in Canton • Customer Service Culture • Full Suite of Traditional Retail Banking Products Profitable Merchant, Debit and Credit Card Businesses Consumer Banking: Broad Servi
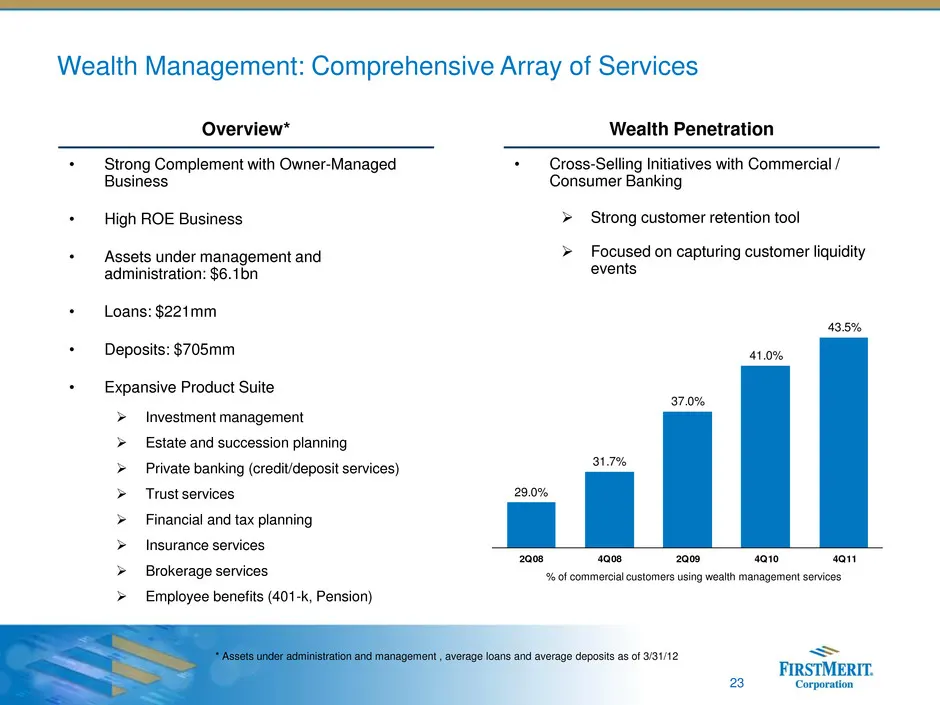
Slide 23: Wealth Management: Comprehensive Array of Services
23 • Strong Complement with Owner-Managed Business • High ROE Business • Assets under management and administration: $6.1bn • Loans: $221mm • Deposits: $705mm • Expansive Product Suite Investment management Estate and succession planning Private banking (credit/deposit services) Trust servic
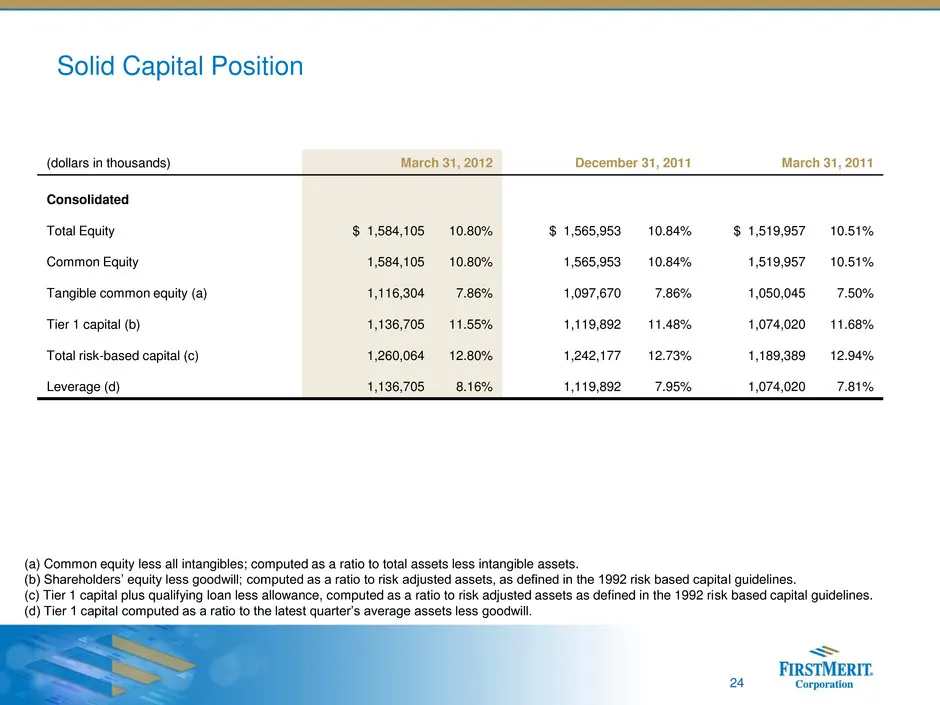
Slide 24: Capital ratios table
24 (dollars in thousands) March 31, 2012 December 31, 2011 March 31, 2011 Consolidated Total Equity $ 1,584,105 10.80% $ 1,565,953 10.84% $ 1,519,957 10.51% Common Equity 1,584,105 10.80% 1,565,953 10.84% 1,519,957 10.51% Tangible common equity (a) 1,116,304 7.86% 1,097,670 7.86% 1,050,045 7.50% Tie
Slide 25: Efficiency Initiative Update
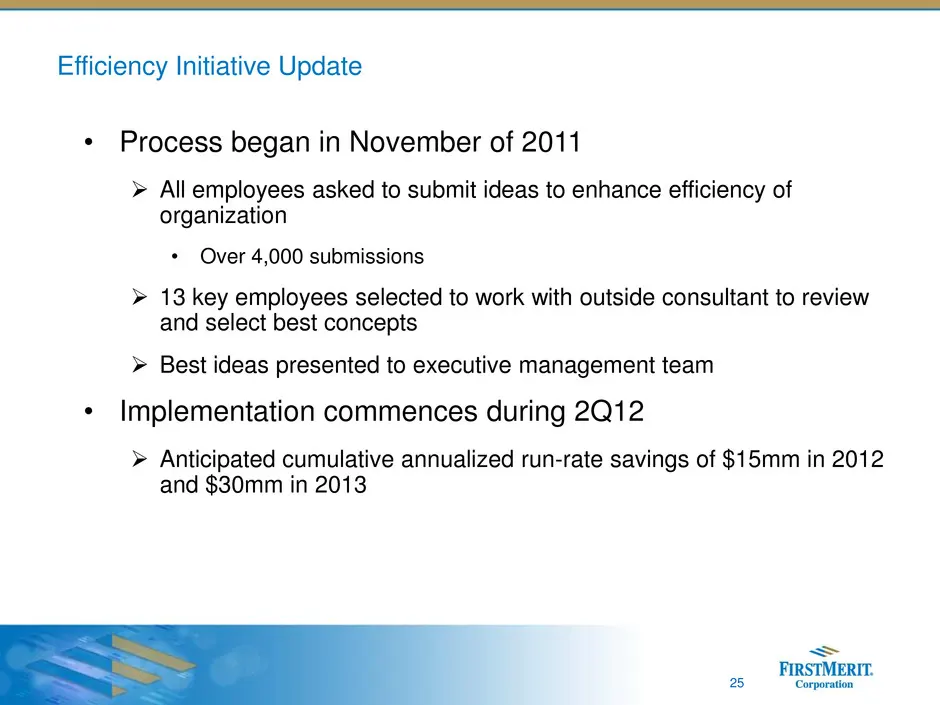
Efficiency Initiative Update • Process began in November of 2011 All employees asked to submit ideas to enhance efficiency of organization • Over 4,000 submissions 13 key employees selected to work with outside consultant to review and select best concepts Best ideas presented to executive man
Slide 26: Efficiency Initiative Ideas
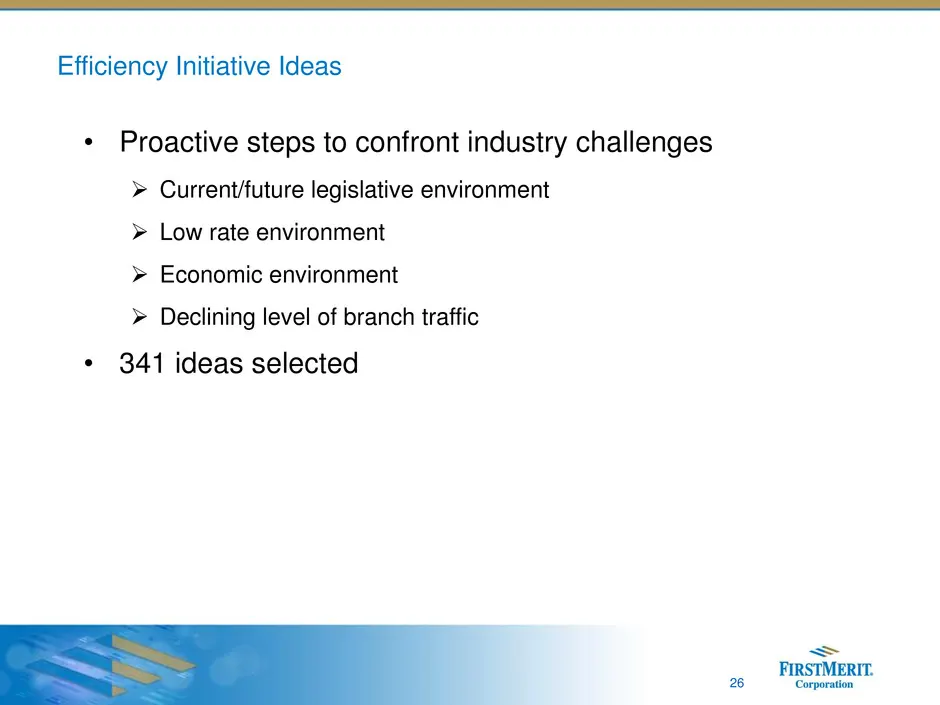
Efficiency Initiative Ideas • Proactive steps to confront industry challenges Current/future legislative environment Low rate environment Economic environment Declining level of branch traffic • 341 ideas selected 26
Slide 27: Efficiency Initiative Actions
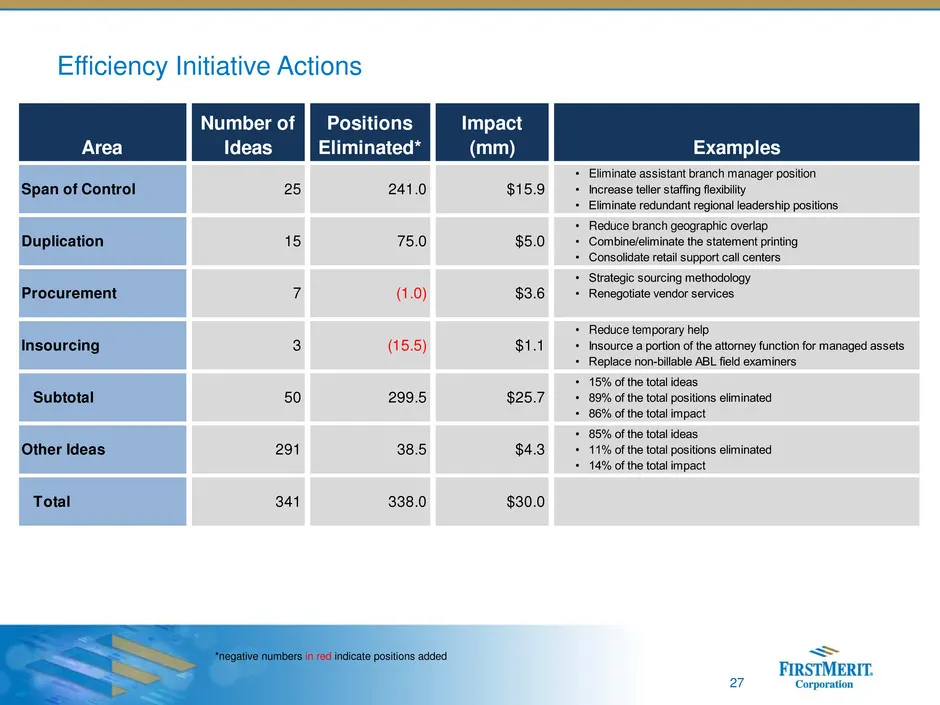
Efficiency Initiative Actions 27 Area Number of Ideas Positions Eliminated* Impact (mm) Examples • Eliminate assistant branch manager position • Increase teller staffing flexibility • Eliminate redundant regional leadership positions • Reduce branch geographic overlap • Combine/eliminate the stateme
Slide 28: The FirstMerit Opportunity
• Strong Platform Consistent quarterly profits Credit discipline Strong balance sheet Solid capital position • Franchise Positioned for Organic Growth Market leadership in core markets Opportunity to expand the franchise The FirstMerit Opportunity 28 Focused on Shareholder Returns
Source: SEC EDGAR · 8-K filed May 15, 2012
More decks from Firstmerit Corp
 Credit Suisse Financial Services Forum 201626 slides · Feb 10, 2016
 Merger or Acquisition (January 2016)18 slides · Jan 26, 2016
 Q3 2015 Earnings Presentation24 slides · Oct 27, 2015
 Q2 2015 Earnings Presentation22 slides · Jul 28, 2015
 Q1 2015 Earnings Presentation21 slides · Apr 28, 2015
 Q4 2014 Earnings Presentation23 slides · Jan 27, 2015