Temple-Inland — UBS Paper & Forest Products Conference 2006
30 slides from Temple-Inland's conference presentation, Sep 19, 2006
Slide 1: UBS Paper & Forest Products Conference
September 19, 2006 UBS Paper & Forest Products Conference
Slide 2: Forward-looking statements
This presentation contains "forward-looking statements" within the meaning of the federal securities laws. These forward-looking statements reflect management's current views with respect to future events and are subject to risks and uncertainties. Factors and uncertainties that could cause our actu
Slide 3: Non-GAAP financial measures notice
This presentation includes certain non-GAAP financial measures. The required reconciliations to GAAP financial measures can be found at www.templeinland.com.
Slide 4: Our Key Objective: Creating Superior and Sustainable Shareholder Value
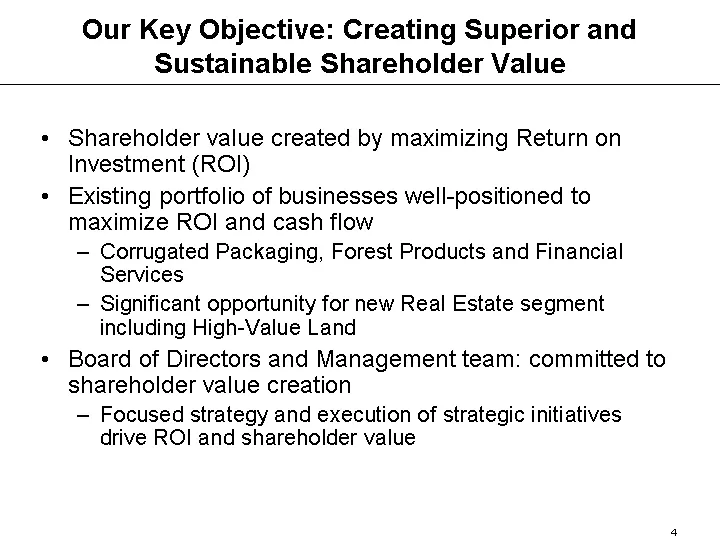
Our Key Objective: Creating Superior and Sustainable Shareholder Value Shareholder value created by maximizing Return on Investment (ROI) Existing portfolio of businesses well-positioned to maximize ROI and cash flow Corrugated Packaging, Forest Products and Financial Services Significant opportunit
Slide 5: Our Strategy is Focused on Driving ROI
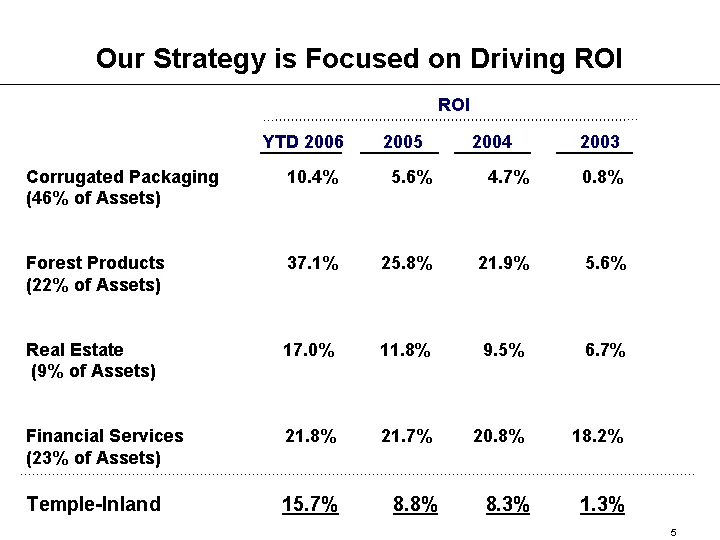
Our Strategy is Focused on Driving ROI Corrugated Packaging 10.4% 5.6% 4.7% 0.8% (46% of Assets) Forest Products 37.1% 25.8% 21.9% 5.6% (22% of Assets) Real Estate 17.0% 11.8% 9.5% 6.7% (9% of Assets) Financial Services 21.8% 21.7% 20.8% 18.2% (23% of Assets) Temple-Inland 15.7% 8.8% 8.3% 1.3% YTD 2
Slide 6: Temple-Inland Strategy
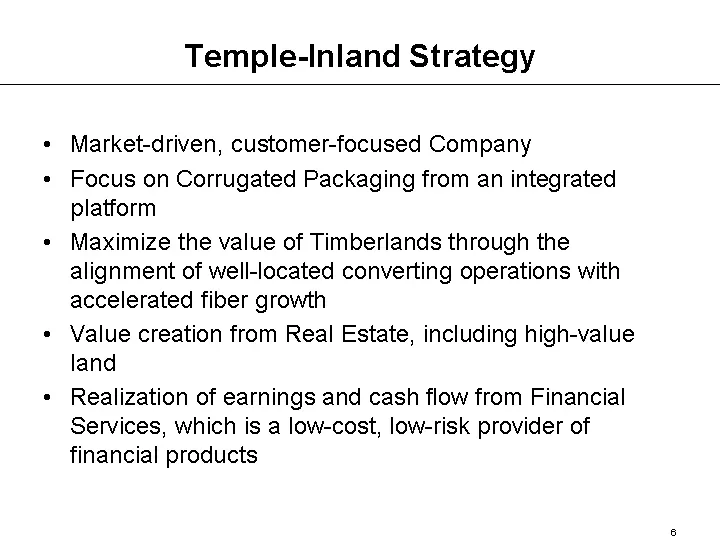
Temple-Inland Strategy Market-driven, customer-focused Company Focus on Corrugated Packaging from an integrated platform Maximize the value of Timberlands through the alignment of well-located converting operations with accelerated fiber growth Value creation from Real Estate, including high-value l
Slide 7: Our Success In Creating Shareholder Value
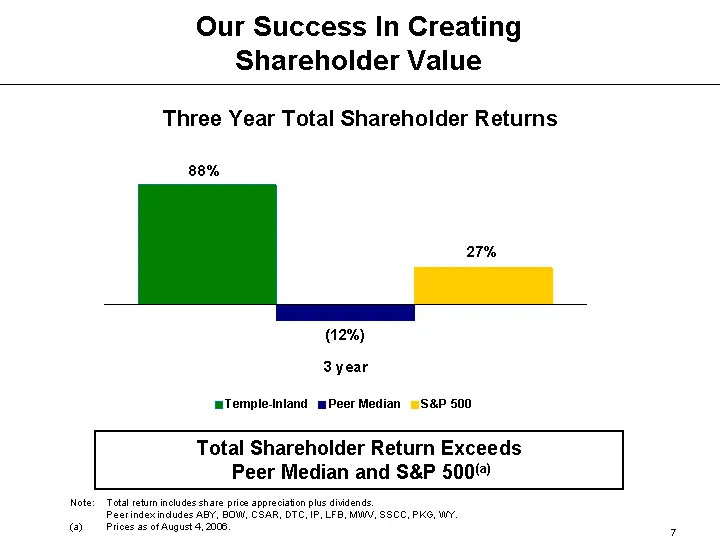
Our Success In Creating Shareholder Value 3 year Temple-Inland 88 Peer Median -12 S&P 500 27 Note: Total return includes share price appreciation plus dividends. Peer index includes ABY, BOW, CSAR, DTC, IP, LFB, MWV, SSCC, PKG, WY. (a) Prices as of August 4, 2006. Total Shareholder Return Exceeds Pe
Slide 8: Top ROI Performance 2005
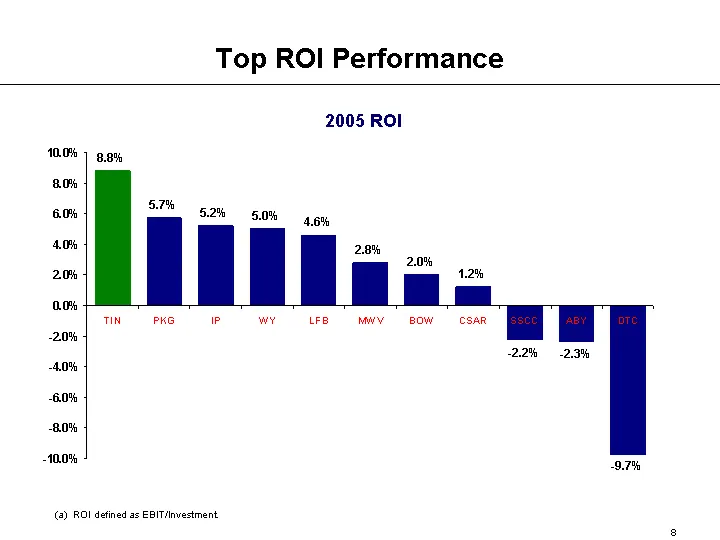
Top ROI Performance 2005 ROI (a) ROI defined as EBIT/Investment. TIN PKG IP WY LFB MWV BOW CSAR SSCC ABY DTC 0.088 0.057 0.052 0.05 0.046 0.028 0.02 0.012 -0.022 -0.023 -0.097 PKG LFB
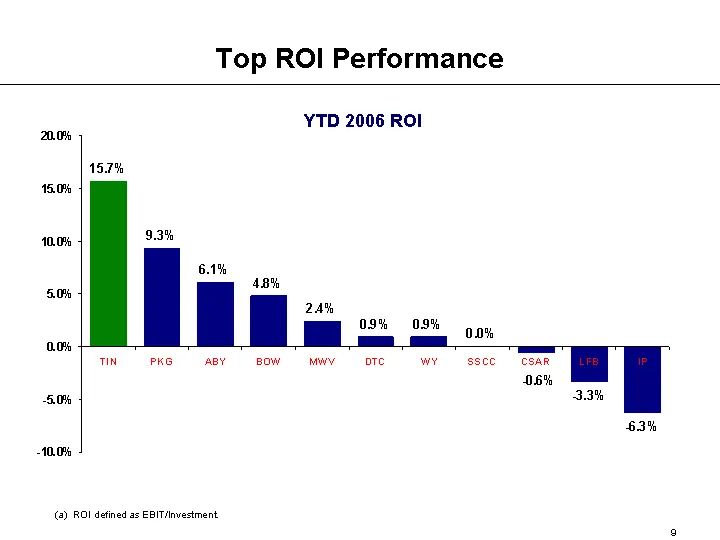
Slide 9: Top ROI Performance YTD 2006
TIN PKG ABY BOW MWV DTC WY SSCC CSAR LFB IP 0.157 0.093 0.061 0.048 0.024 0.009 0.009 0 -0.006 -0.033 -0.063 PKG LFB (a) ROI defined as EBIT/Investment. YTD 2006 ROI Top ROI Performance
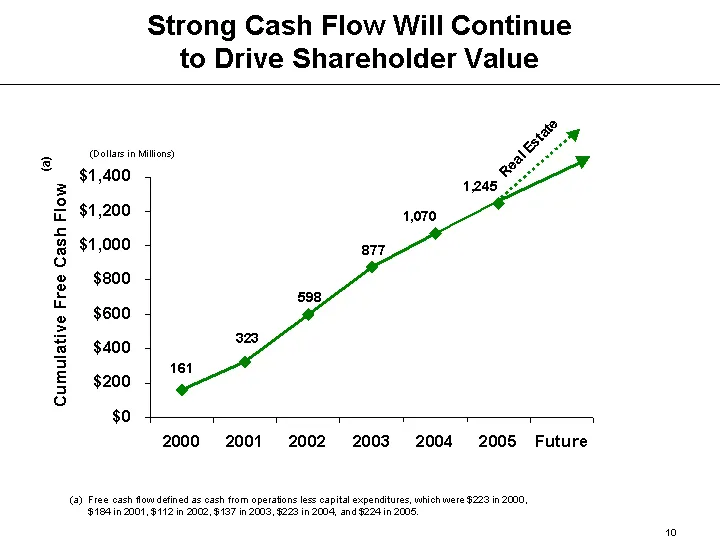
Slide 10: Strong Cash Flow Will Continue to Drive Shareholder Value
Strong Cash Flow Will Continue to Drive Shareholder Value 2000 2001 2002 2003 2004 2005 Future 161 323 598 877 1070 1245 Real Estate (a) (a) Free cash flow defined as cash from operations less capital expenditures, which were $223 in 2000, $184 in 2001, $112 in 2002, $137 in 2003, $223 in 2004, and
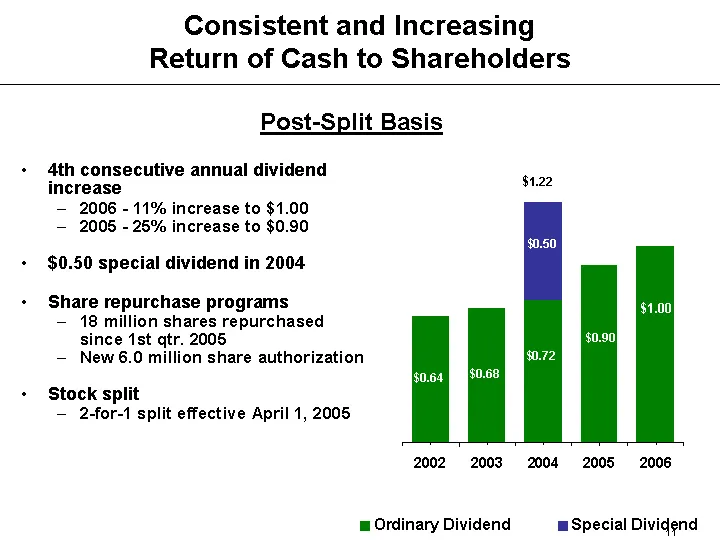
Slide 11: Consistent and Increasing Return of Cash to Shareholders
Consistent and Increasing Return of Cash to Shareholders 4th consecutive annual dividend increase 2006 - 11% increase to $1.00 2005 - 25% increase to $0.90 $0.50 special dividend in 2004 Share repurchase programs 18 million shares repurchased since 1st qtr. 2005 New 6.0 million share authorization S
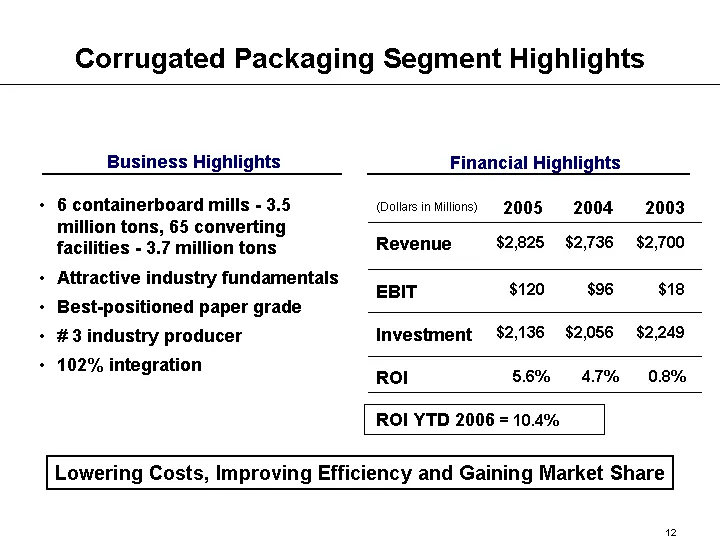
Slide 12: Corrugated Packaging Segment Highlights
Corrugated Packaging Segment Highlights 6 containerboard mills - 3.5 million tons, 65 converting facilities - 3.7 million tons Attractive industry fundamentals Best-positioned paper grade # 3 industry producer 102% integration Business Highlights Lowering Costs, Improving Efficiency and Gaining Mark
Slide 13: Corrugated Packaging Operating Income Improvement
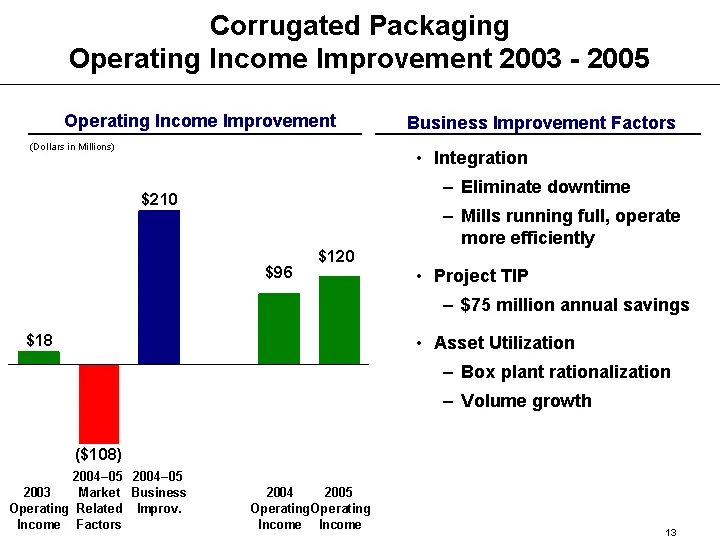
Corrugated Packaging Operating Income Improvement 2003 - 2005 Operating Income Improvement (Dollars in Millions) Business Improvement Factors Integration Eliminate downtime Mills running full, operate more efficiently Project TIP $75 million annual savings Asset Utilization Box plant rationalization
Slide 14: Corrugated Packaging Business Improvement
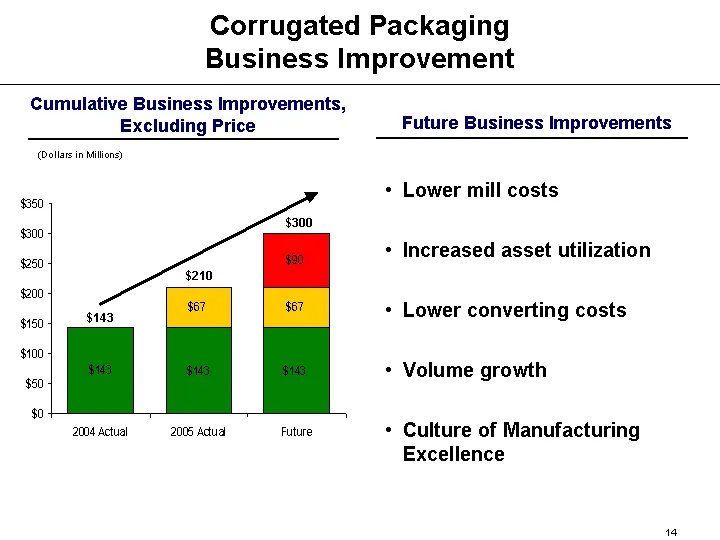
Corrugated Packaging Business Improvement 2004 Actual 143 2005 Actual 143 67 Future 143 67 90 Cumulative Business Improvements, Excluding Price (Dollars in Millions) $210 $143 $300 Lower mill costs Increased asset utilization Lower converting costs Volume growth Culture of Manufacturing Excellence F
Slide 15: Corrugated Packaging Comparative Cost Performance
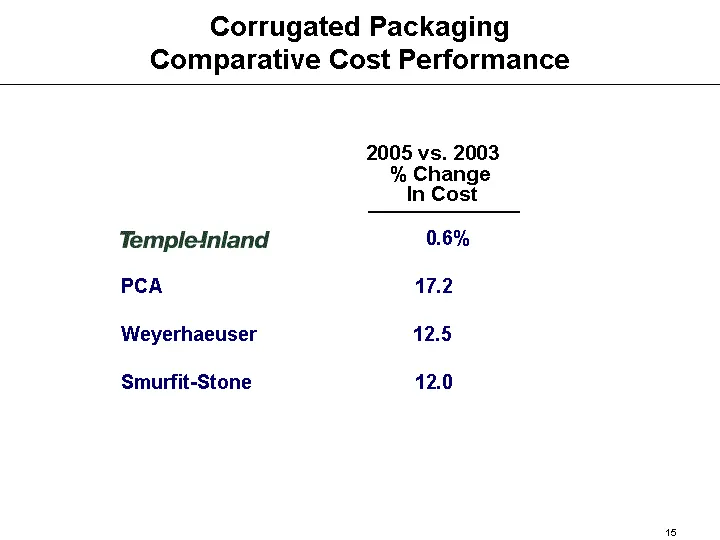
Corrugated Packaging Comparative Cost Performance 0.6% PCA 17.2 Weyerhaeuser 12.5 Smurfit-Stone 12.0 2005 vs. 2003 % Change In Cost
Slide 16: Forest Products Segment Highlights
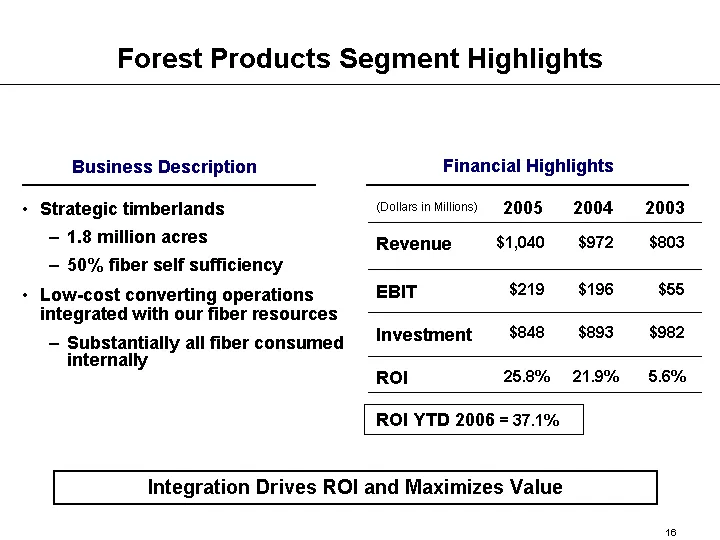
Forest Products Segment Highlights Strategic timberlands 1.8 million acres 50% fiber self sufficiency Low-cost converting operations integrated with our fiber resources Substantially all fiber consumed internally Business Description Integration Drives ROI and Maximizes Value Financial Highlights (D
Slide 17: Integrated Wood Products Business
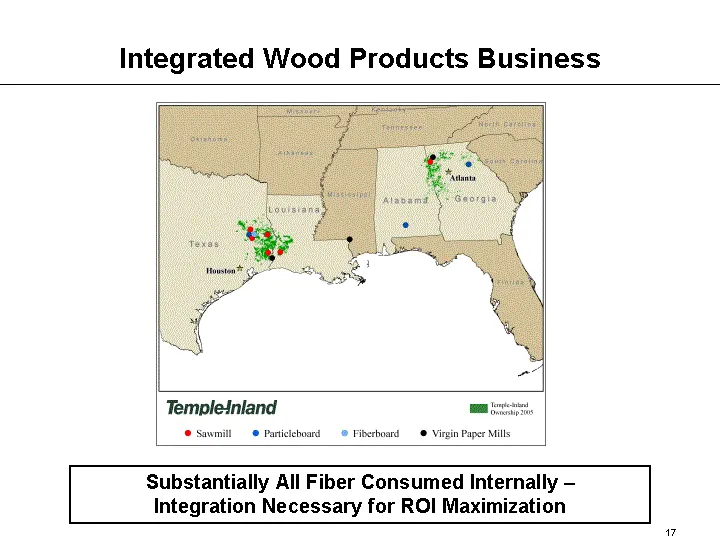
Integrated Wood Products Business Substantially All Fiber Consumed Internally - Integration Necessary for ROI Maximization
Slide 18: Higher Returns from Increasing Harvest
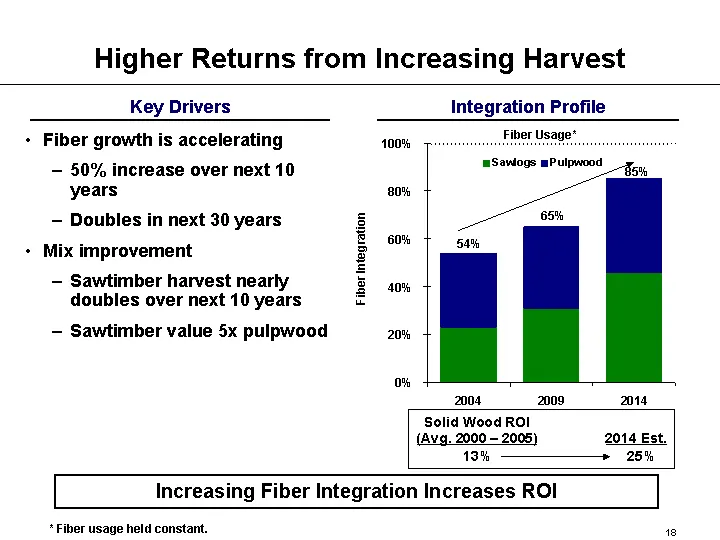
2004 2009 2014 Sawlogs 23 31 46 Pulpwood 31 34 39 Higher Returns from Increasing Harvest Fiber growth is accelerating 50% increase over next 10 years Doubles in next 30 years Mix improvement Sawtimber harvest nearly doubles over next 10 years Sawtimber value 5x pulpwood Key Drivers Integration Profi
Slide 19: Real Estate Segment Highlights
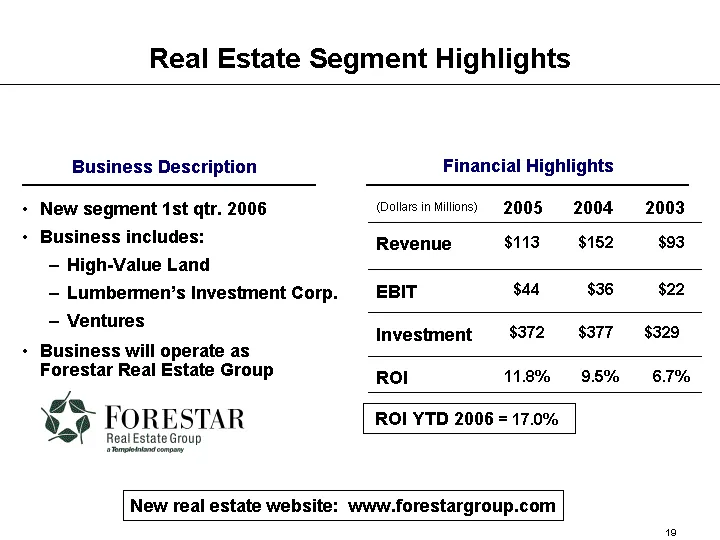
Real Estate Segment Highlights New segment 1st qtr. 2006 Business includes: High-Value Land Lumbermen's Investment Corp. Ventures Business will operate as Forestar Real Estate Group Business Description Financial Highlights (Dollars in Millions) 2005 2004 2003 Revenue $113 $152 $93 EBIT $44 $36 $22
Slide 20: Population Growth
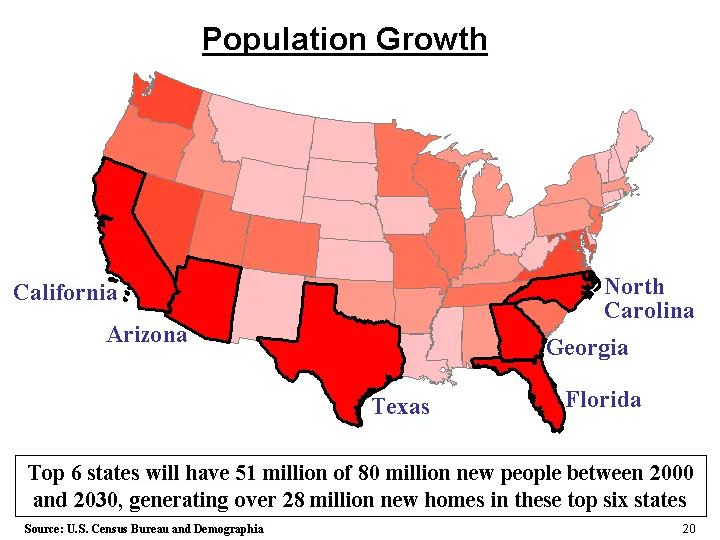
Population Growth California Arizona Texas Florida North Carolina Georgia Source: U.S. Census Bureau and Demographia 20 Top 6 states will have 51 million of 80 million new people between 2000 and 2030, generating over 28 million new homes in these top six states
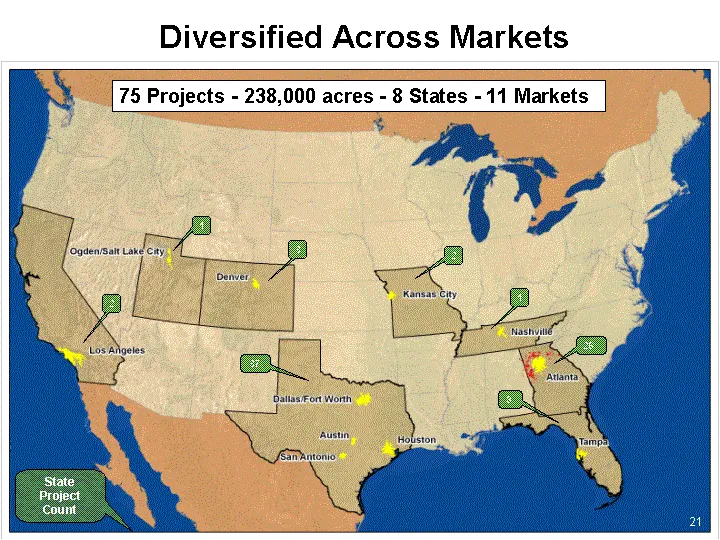
Slide 21: State Project Count Diversified Across Markets
2 3 37 2 1 1 3 26 State Project Count Diversified Across Markets 75 Projects - 238,000 acres - 8 States - 11 Markets 21
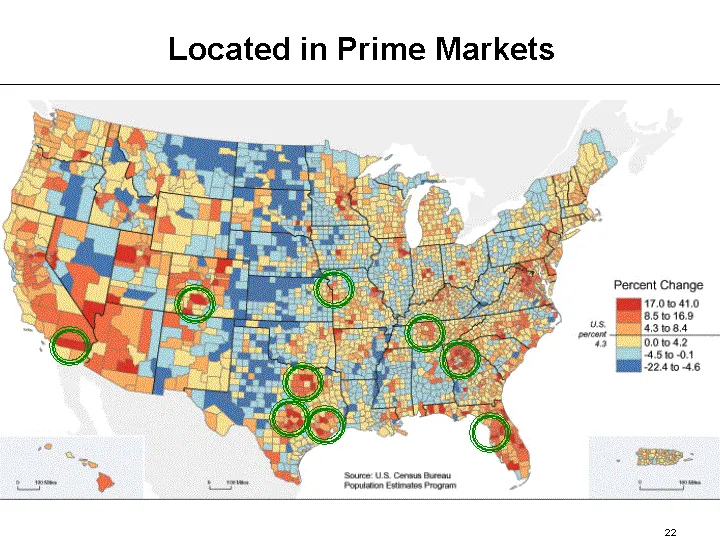
Slide 22: Located in Prime Markets
Located in Prime Markets Percent Change 17.010 41.0
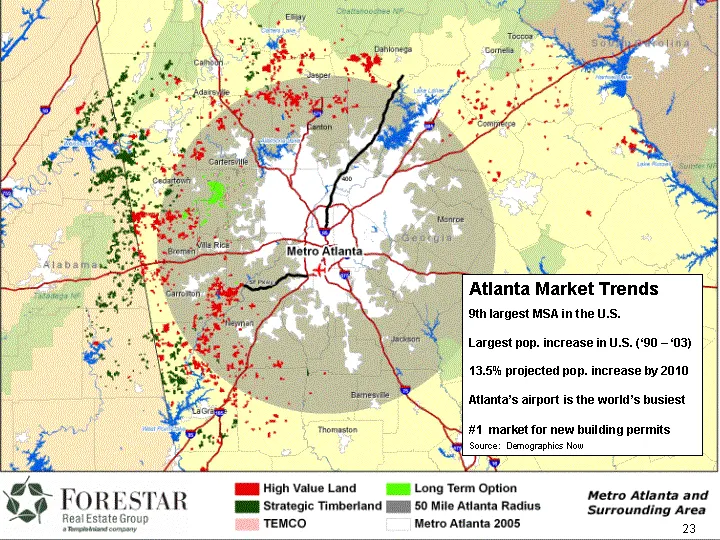
Slide 23: Atlanta Market Trends
Atlanta Market Trends 9th largest MSA in the U.S. Largest pop. increase in U.S. ('90 - '03) 13.5% projected pop. increase by 2010 Atlanta's airport is the world's busiest #1 market for new building permits Source: Demographics Now 23
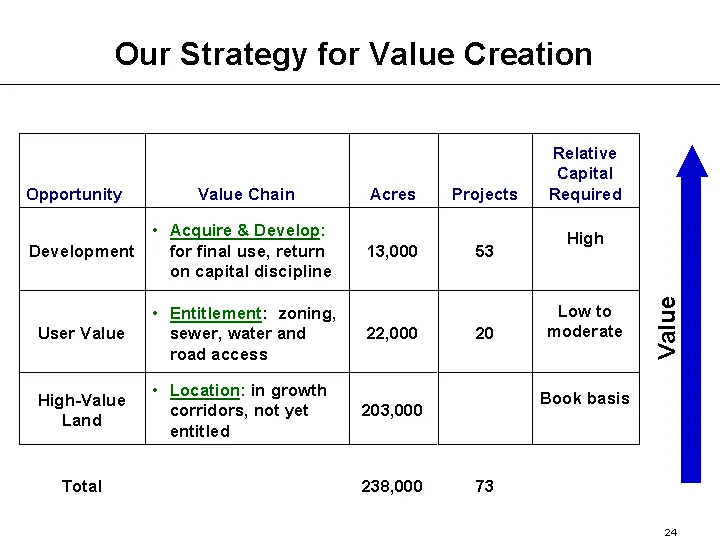
Slide 24: Our Strategy for Value Creation
Our Strategy for Value Creation Opportunity Value Chain Acres Projects Relative Capital Required Development Acquire & Develop: for final use, return on capital discipline 13,000 53 High User Value Entitlement: zoning, sewer, water and road access 22,000 20 Low to moderate High-Value Land Location:
Slide 25: Real Estate Pipeline (Acres)
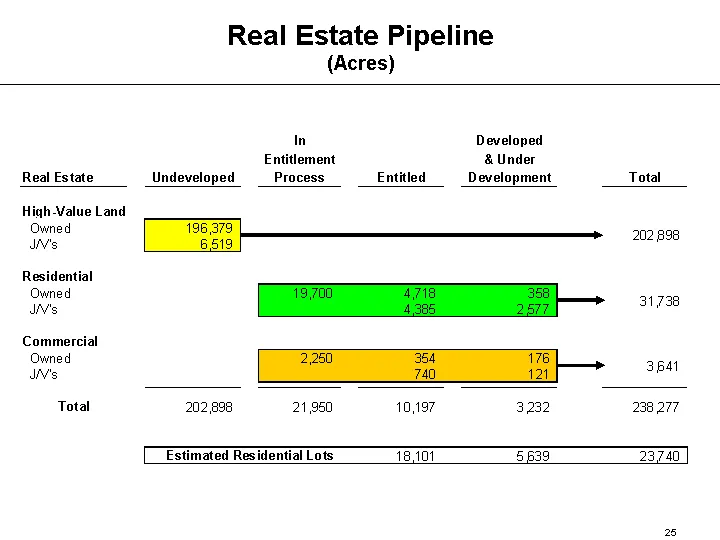
Real Estate Pipeline (Acres)
Slide 26: Financial Services Segment Highlights
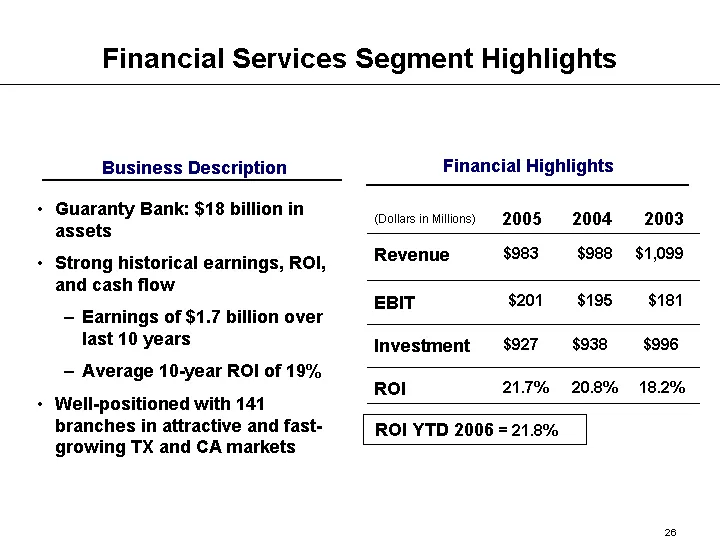
Financial Services Segment Highlights Guaranty Bank: $18 billion in assets Strong historical earnings, ROI, and cash flow Earnings of $1.7 billion over last 10 years Average 10-year ROI of 19% Well-positioned with 141 branches in attractive and fast- growing TX and CA markets Business Description Fi
Slide 27: High Growth Deposit Markets And Asset Growth Loan Markets
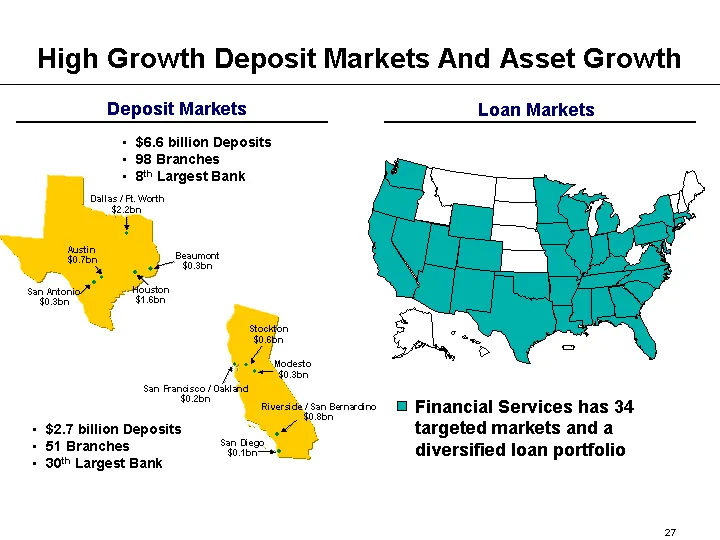
High Growth Deposit Markets And Asset Growth Loan Markets Dallas / Ft. Worth $2.2bn Beaumont $0.3bn Houston $1.6bn San Antonio $0.3bn Austin $0.7bn Modesto $0.3bn Stockton $0.6bn Riverside / San Bernardino $0.8bn San Diego $0.1bn San Francisco / Oakland $0.2bn $6.6 billion Deposits 98 Branches 8th L
Slide 28: Temple-Inland YTD 2006 Financial Results
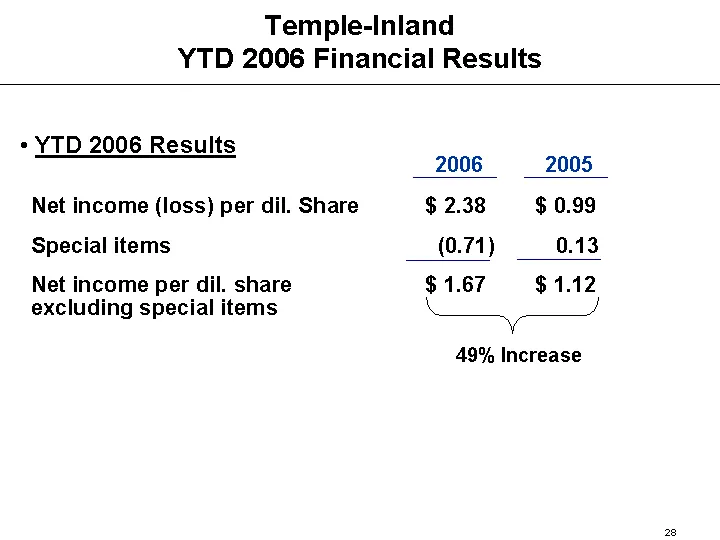
Temple-Inland YTD 2006 Financial Results Net income (loss) per dil. Share $ 2.38 $ 0.99 Special items (0.71) 0.13 Net income per dil. share $ 1.67 $ 1.12 excluding special items 2006 2005 YTD 2006 Results 49% Increase
Slide 29: Temple-Inland Summary
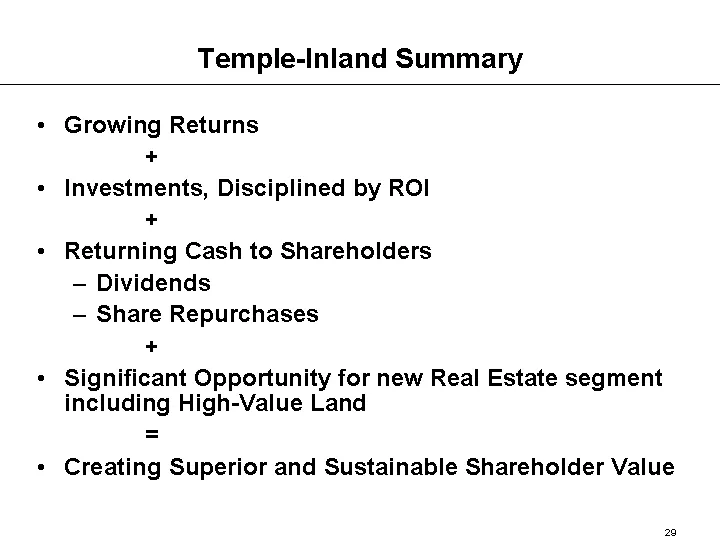
Temple-Inland Summary Growing Returns + Investments, Disciplined by ROI + Returning Cash to Shareholders Dividends Share Repurchases + Significant Opportunity for new Real Estate segment including High-Value Land = Creating Superior and Sustainable Shareholder Value

Slide 30: Temple-Inland
Templetniland
Source: SEC EDGAR · 8-K filed Sep 19, 2006
More decks from Temple-Inland Inc
 Q2 2011 Earnings Presentation17 slides · Jul 21, 2011
 Proxy Contest (June 2011)43 slides · Jun 20, 2011
 Merger or Acquisition (June 2011)38 slides · Jun 6, 2011
 Q1 2011 Earnings Presentation16 slides · Apr 20, 2011
 Investor Presentation (February 2011)35 slides · Feb 14, 2011
 Q4 2010 Earnings Presentation28 slides · Feb 8, 2011